Adobe Illustrator Tutorial: Crafting Stylish Infographics

 May 5, 2025

 HarryGonzalez

 8
8
Mastering Infographic Design with Adobe Illustrator
Infographics are a fantastic way to present complex information in a visually engaging and easy-to-understand format. In this guide, we'll dive into how you can use Adobe Illustrator to craft professional-quality infographics that tell a compelling visual story and captivate your audience.
Key Points
- Understand the basics of infographic design.
- Learn to effectively utilize Adobe Illustrator's tools.
- Create custom graphics and illustrations.
- Incorporate data visualization techniques.
- Design with clarity and visual hierarchy in mind.
- Prepare your infographic for various platforms.
Getting Started with Infographic Design
What is Infographic Design?
Infographics are more than just pretty pictures; they're powerful storytelling tools. By combining Adobe Illustrator with solid design principles, you can create visuals that simplify complex data and engage a wide audience. They grab attention, boost memory retention, and are perfect for sharing on social media. That's why businesses love them for communication and marketing goals.
Setting Up Your Adobe Illustrator Workspace
Before you jump into designing, setting up your Adobe Illustrator workspace can make all the difference in your efficiency.
Your workspace is your command center, equipped with all the tools and panels you need to create stunning infographics. Here's how to set it up:
- Create a New Document: Start fresh with a document tailored to your infographic's needs. Go to File > New and set your dimensions. Common sizes include:
- Standard: 800 x 2000 pixels
- Tall: 800 x 3000 pixels
- Wide: 1200 x 1800 pixels
Choosing the right size ensures your infographic looks great on any platform.
- Configure Your Color Mode: For online sharing, set your color mode to RGB via File > Document Color Mode. For print, switch to CMYK.
- Essential Panels: Keep these panels handy under the Window menu:
- Layers: Organize your design elements.
- Properties: Quick access to object settings.
- Stroke: Adjust stroke weights and styles.
- Color: Select and manage colors.
- Swatches: Save and reuse color palettes.
- Type: Format and style text.
- Custom Workspaces: Customize your workspace to suit your workflow. Arrange your panels and toolbars, then save it under Window > Workspace > New Workspace. This saves time in future projects.
- Units: Set your document to pixels for web designs, or inches for print, via Edit > Preferences > Units.
By optimizing your workspace, you'll be ready to tackle any infographic design project with ease and precision.
Understanding Basic Design Principles
Before you start designing, it's essential to grasp the basic design principles that will make your infographics visually cohesive and effective.
- Hierarchy: Use size, color, and placement to guide the viewer's eye to the most important information.
This ensures your key points are quickly understood.
- Balance: Achieve either symmetrical or asymmetrical balance to keep your design pleasing to the eye.
- Contrast: Make elements stand out with high contrast, enhancing readability and accessibility.
- Color Theory: Use complementary and analogous colors to create visually harmonious designs that reinforce your message.
- White Space: Don't overcrowd your design. Use white space to let elements breathe, improving readability and overall design quality.
- Consistency: Maintain a consistent look in typography, color, and visual elements for a unified and professional appearance.
By applying these principles, you'll create infographics that are not only informative but also engaging and visually appealing.
Practical Illustration in Adobe Illustrator
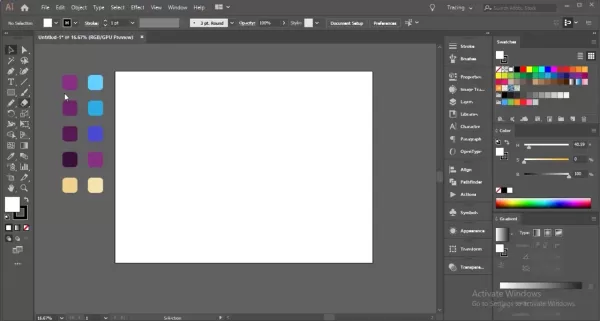
Crafting a Visually Engaging Background
The background sets the stage for your infographic. Here's how to create one that's both engaging and cohesive:
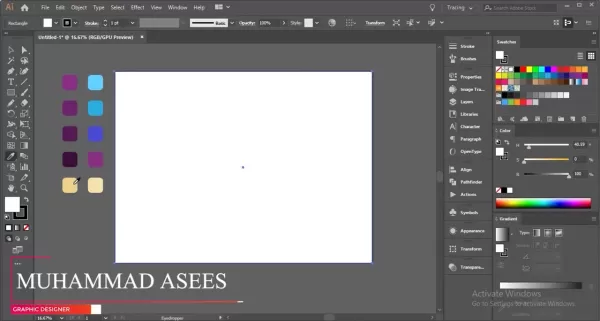
- Rectangle Tool: Start by drawing a rectangle that covers your entire artboard using the Rectangle Tool (M).
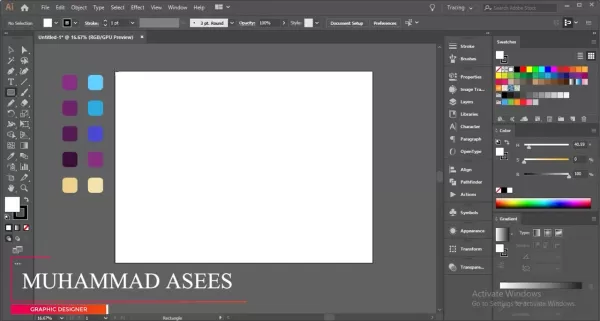
This will be the base of your background.
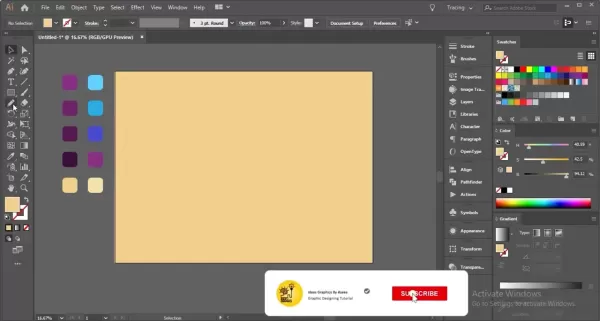
- Color Gradient: Apply a subtle gradient in the Gradient panel to add depth and interest.
- Background Elements: Add shapes and lines for visual interest. Consider circles, squares, or custom-drawn elements.
- Opacity Adjustments: Lower the opacity of these elements to ensure they don't overwhelm the main content.
- Shape Builder Tool: Use this tool (Shift+M) to merge or subtract shapes for unique designs.
- Adding Circles: Use the Ellipse Tool (L) to create circles of varying sizes and positions.
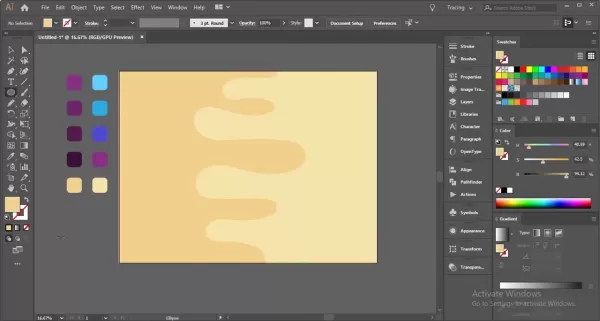
- Using the Pen Tool: Draw wavy paths with the Pen Tool (P) for a liquid effect.
- Adding a Rectangle Shape: Place a rectangle behind your wavy paths to use with the Shape Builder Tool.
- Selecting All Shape Paths: Use the Path Selection Tool (A) and the Shape Builder Tool (Shift+M) to refine your design.
- Refining Circle Placement: Adjust circle size and position for a balanced layout.
- Anchor Points: Customize circles with different anchor point shapes for added style.
These techniques will help you create a background that enhances your infographic's content and visual impact.
Creating a Compelling Drink Illustration
Illustrations can bring your infographics to life. Here's how to create a drink illustration that tells a visual story:
- Base Shape: Use the Rectangle Tool (M) to draw the glass or mug, refining it to match your desired style.
- Adding the Stand and Base: Use the Ellipse Tool (L) for the base, and adjust with the Direct Selection Tool (A) for a rounded look.
- Creating Drink Foam/Head: Draw foam with the Pen Tool (P) at the top of the glass.
- Add Some Bubbles: Use the Ellipse Tool (L) to add bubbles inside the drink.
- Straws: Create a straw using the Rectangle Tool (M).
- Adding Highlights and Shadows: Use transparency adjustments to add depth and realism.
These steps will help you craft detailed and engaging infographics.
Step-by-Step Guide to Create Awesome Visuals
Step 1: Laying the Base Layers of Our Design
Begin by creating a background using the Rectangle Tool (M), followed by liquid pathways with the Pen Tool and refining them with the Shape Builder Tool.
Step 2: Creating Our Mug Infographics
After setting the base, create a standout mug illustration using the Rectangle Tool and custom modifications for a 3D effect.
Step 3: Linking Data Connections to the Images
Data is crucial. Use circles and rectangles to visually connect your data points to the images, adding context to your design.
Step 4: Finishing Touches
Finalize your design by applying colors from your base design and aligning all elements using Illustrator's alignment tools.
Adobe Illustrator Pricing Plans
Understanding Adobe Illustrator's Subscription Model
Adobe Illustrator operates on a subscription-based model, offering various plans to meet different user needs. These plans are part of the Adobe Creative Cloud suite, ensuring you always have the latest features and updates. Pricing varies based on subscription duration and whether you bundle it with other Adobe apps. For the most current pricing, check Adobe's official website.
Individual Plans
- Illustrator Single App: Perfect for dedicated Illustrator users, including 100GB of cloud storage, Adobe Fonts, and Behance integration.
- Creative Cloud All Apps: Ideal for professionals needing multiple Adobe apps, offering over 20 apps and 100GB of cloud storage.
Business Plans
- Illustrator for Teams: Designed for businesses requiring multiple licenses, with centralized administration and collaborative features.
- Creative Cloud for Teams: Provides access to all Creative Cloud apps for team use, with additional collaboration tools.
Student and Teacher Plans
- Creative Cloud for Students and Teachers: A discounted plan for eligible students and educators, providing access to all Creative Cloud apps at a reduced price.
Here's a simplified breakdown of the pricing structure:
Plan Description Key Features Illustrator Single App Best for individual Illustrator users 100GB cloud storage, Adobe Fonts, Behance integration Creative Cloud All Apps Comprehensive access to all Adobe apps for individuals Access to over 20 apps, 100GB cloud storage, Adobe Fonts, Behance integration Illustrator for Teams For businesses needing Illustrator licenses Centralized administration, advanced support, collaborative features Creative Cloud for Teams Comprehensive access to all Adobe apps for teams All Creative Cloud apps, centralized administration, advanced support, collaborative features Creative Cloud for Students/Teachers Discounted access to all Creative Cloud apps for eligible students/teachers Access to over 20 apps at a reduced price, subject to eligibility verification
When choosing a plan, consider your specific design needs and how often you'll use the software. The single app plan is great for focused Illustrator users, while the all apps plan suits those working on varied projects.
Adobe Illustrator for Infographics: Weighing the Pros and Cons
Pros
- High-Quality Vector Graphics: Allows designs to scale without quality loss.
- Precise Typography Controls: Extensive options for text formatting.
- Versatile Shape and Path Tools: Enables custom illustrations and graphics.
- Advanced Color Management: Facilitates consistent and harmonious color schemes.
- Seamless Integration: Works well with other Adobe Creative Cloud applications.
Cons
- Steep Learning Curve: Can be challenging for beginners to master.
- Subscription-Based Pricing: Requires ongoing payments, which may not suit everyone.
- Resource-Intensive: May need powerful hardware for complex designs.
- Not Ideal for Heavy Data Visualization: Primarily a graphic design tool, not a dedicated data visualization platform.
- Overwhelming Number of Features: Can be difficult to navigate and use effectively.
Adobe Illustrator Core Features for Infographic Design
Key Features That Make Illustrator Ideal for Infographics
Adobe Illustrator is packed with features that make it perfect for infographic design. Here are some key tools:
- Vector Graphics: Illustrator's vector capabilities mean your designs can scale without losing quality.
This is vital for infographics that need to be viewed at various sizes. - Typography Tools: Fine-tune your text with robust typography options, adjusting font styles, sizes, and spacing for clear and appealing layouts.
- Shape and Path Tools: Use the Pen Tool, Shape Builder Tool, and Pathfinder panel to create and refine custom graphics with precision.
- Color Management: Manage color schemes easily with the Swatches and Color Guide panels, ensuring design consistency.
- Data Visualization: While not a primary data tool, Illustrator can import and customize charts and graphs, helping you visually represent data.
- Layers: Organize design elements using layers, making it easier to edit and manage complex designs.
Real-World Use Cases for Infographics
Diverse Applications of Infographics Across Industries
Infographics are incredibly versatile, used across various industries for different purposes:
- Marketing and Advertising: Use infographics to showcase product features, customer testimonials, and market trends. Companies like HubSpot and Neil Patel Digital use them to drive traffic and generate leads.
- Education: Simplify complex subjects for students. Teachers and institutions use them to explain scientific concepts, historical timelines, and more.
- Journalism: Enhance news articles with data-driven infographics. Media outlets like The New York Times and The Guardian use them to provide context on current events.
- Healthcare: Communicate medical information and health statistics clearly. Organizations like the Mayo Clinic and the CDC use infographics for public health awareness.
- Business and Finance: Illustrate financial data and business strategies. Companies use them in annual reports and presentations to aid decision-making.
- Non-Profit Organizations: Raise awareness about social issues and showcase campaign impacts. Non-profits like UNICEF and the World Wildlife Fund use infographics to engage donors and the public.
Industry Use Case Example Application Marketing & Ads Present product features, testimonials, trends HubSpot uses infographics to explain inbound marketing strategies and generate leads. Education Simplify complex subjects, timelines, principles Teachers use infographics to break down scientific concepts and historical events for students. Journalism Enhance news articles and reports with data-driven visuals The New York Times uses infographics to provide context and insights into current events and complex issues. Healthcare Communicate medical information, treatment options, stats Mayo Clinic uses infographics to educate patients about diseases, treatment options, and preventive healthcare measures. Business & Finance Illustrate financial data, strategies, performance Companies use infographics in annual reports and presentations to highlight key financial metrics and business strategies. Non-Profits Raise awareness, showcase impact, communicate goals UNICEF uses infographics to raise awareness about children’s rights and showcase the impact of their programs on a global scale.
Understanding these applications helps you tailor your infographic designs to meet specific industry needs and goals.
Frequently Asked Questions (FAQ)
What are the best Adobe Illustrator tools for creating infographics?
Adobe Illustrator offers several tools that are particularly useful for infographic design. These include the Pen Tool (P) for custom shapes, the Shape Builder Tool (Shift+M) for merging shapes, the Type Tool (T) for text formatting, and the Graph tools for data visualization. The Pathfinder and Align panels are also essential for precise editing and layout.
How can I ensure my infographic is visually appealing and easy to read?
To make your infographic visually appealing and easy to read, focus on visual hierarchy, contrast, and white space. Use size, color, and placement to highlight important information. Maintain high contrast for readability, avoid overcrowding, and keep consistency in typography and visuals to guide viewers through your story.
What are the ideal dimensions for an infographic?
The ideal dimensions depend on your infographic's intended use. Common sizes include:
- Standard: 800 x 2000 pixels
- Tall: 800 x 3000 pixels
- Wide: 1200 x 1800 pixels
Choose dimensions that fit the platform where your infographic will be displayed.How do I export my infographic for different platforms?
When exporting, consider the platform. For web, save as PNG or JPEG at 72 DPI for quick loading. For print, use PDF at 300 DPI for high-quality output. Adjust settings to meet each platform's requirements.
Related Questions
How can I add a background to my infographic in Adobe Illustrator?
Adding a background in Adobe Illustrator involves several steps to enhance your infographic's visual appeal without overshadowing the content. Start with the Rectangle Tool (M) to cover the artboard, then apply a subtle gradient using the Gradient panel. Add shapes and lines, adjusting their opacity to complement your design. Use the Shape Builder Tool (Shift+M) to create unique patterns by merging or subtracting shapes. Add circles with the Ellipse Tool for balance, and adjust their colors and blend modes for cohesion. For a dynamic effect, consider adding textured overlays or patterns. Always ensure the background complements your infographic's theme without distracting from the main data.
Related article
 Convert Videos to Text Effortlessly: No Typing Required
Ever found yourself in a situation where you need to transcribe a long video, but the thought of typing out every word is daunting? Whether it's a two-hour lecture or a critical business meeting recording, many of us face this challenge. But fear not! This article is here to introduce you to a hassl
Terminator Future War: Advanced Tech & Survival Strategies
The chilling vision of the Terminator future war, where humanity struggles against a relentless robotic enemy, continues to captivate and inspire strategic thinking. This blog delves into the advanced technology and desperate survival strategies that define this dystopian conflict. By exploring thes
Minecraft Village Exploration: Trading, Farming, and Resource Gathering
Exploring the Heart of Minecraft: VillagesMinecraft villages are more than just a collection of buildings; they're vibrant communities brimming with life and opportunities. Whether you're a seasoned player or just starting out, these villages offer a safe haven, a place to gather resources, and a ch
Comments (0)
0/200
Convert Videos to Text Effortlessly: No Typing Required
Ever found yourself in a situation where you need to transcribe a long video, but the thought of typing out every word is daunting? Whether it's a two-hour lecture or a critical business meeting recording, many of us face this challenge. But fear not! This article is here to introduce you to a hassl
Terminator Future War: Advanced Tech & Survival Strategies
The chilling vision of the Terminator future war, where humanity struggles against a relentless robotic enemy, continues to captivate and inspire strategic thinking. This blog delves into the advanced technology and desperate survival strategies that define this dystopian conflict. By exploring thes
Minecraft Village Exploration: Trading, Farming, and Resource Gathering
Exploring the Heart of Minecraft: VillagesMinecraft villages are more than just a collection of buildings; they're vibrant communities brimming with life and opportunities. Whether you're a seasoned player or just starting out, these villages offer a safe haven, a place to gather resources, and a ch
Comments (0)
0/200
May 5, 2025
HarryGonzalez
8
Mastering Infographic Design with Adobe Illustrator
Infographics are a fantastic way to present complex information in a visually engaging and easy-to-understand format. In this guide, we'll dive into how you can use Adobe Illustrator to craft professional-quality infographics that tell a compelling visual story and captivate your audience.
Key Points
- Understand the basics of infographic design.
- Learn to effectively utilize Adobe Illustrator's tools.
- Create custom graphics and illustrations.
- Incorporate data visualization techniques.
- Design with clarity and visual hierarchy in mind.
- Prepare your infographic for various platforms.
Getting Started with Infographic Design
What is Infographic Design?
Infographics are more than just pretty pictures; they're powerful storytelling tools. By combining Adobe Illustrator with solid design principles, you can create visuals that simplify complex data and engage a wide audience. They grab attention, boost memory retention, and are perfect for sharing on social media. That's why businesses love them for communication and marketing goals.
Setting Up Your Adobe Illustrator Workspace
Before you jump into designing, setting up your Adobe Illustrator workspace can make all the difference in your efficiency.
Your workspace is your command center, equipped with all the tools and panels you need to create stunning infographics. Here's how to set it up:
- Create a New Document: Start fresh with a document tailored to your infographic's needs. Go to File > New and set your dimensions. Common sizes include:
- Standard: 800 x 2000 pixels
- Tall: 800 x 3000 pixels
- Wide: 1200 x 1800 pixels
- Configure Your Color Mode: For online sharing, set your color mode to RGB via File > Document Color Mode. For print, switch to CMYK.
- Essential Panels: Keep these panels handy under the Window menu:
- Layers: Organize your design elements.
- Properties: Quick access to object settings.
- Stroke: Adjust stroke weights and styles.
- Color: Select and manage colors.
- Swatches: Save and reuse color palettes.
- Type: Format and style text.
- Custom Workspaces: Customize your workspace to suit your workflow. Arrange your panels and toolbars, then save it under Window > Workspace > New Workspace. This saves time in future projects.
- Units: Set your document to pixels for web designs, or inches for print, via Edit > Preferences > Units.
By optimizing your workspace, you'll be ready to tackle any infographic design project with ease and precision.
Understanding Basic Design Principles
Before you start designing, it's essential to grasp the basic design principles that will make your infographics visually cohesive and effective.
- Hierarchy: Use size, color, and placement to guide the viewer's eye to the most important information.
This ensures your key points are quickly understood. - Balance: Achieve either symmetrical or asymmetrical balance to keep your design pleasing to the eye.
- Contrast: Make elements stand out with high contrast, enhancing readability and accessibility.
- Color Theory: Use complementary and analogous colors to create visually harmonious designs that reinforce your message.
- White Space: Don't overcrowd your design. Use white space to let elements breathe, improving readability and overall design quality.
- Consistency: Maintain a consistent look in typography, color, and visual elements for a unified and professional appearance.
By applying these principles, you'll create infographics that are not only informative but also engaging and visually appealing.
Practical Illustration in Adobe Illustrator
Crafting a Visually Engaging Background
The background sets the stage for your infographic. Here's how to create one that's both engaging and cohesive:
- Rectangle Tool: Start by drawing a rectangle that covers your entire artboard using the Rectangle Tool (M).
This will be the base of your background. - Color Gradient: Apply a subtle gradient in the Gradient panel to add depth and interest.
- Background Elements: Add shapes and lines for visual interest. Consider circles, squares, or custom-drawn elements.
- Opacity Adjustments: Lower the opacity of these elements to ensure they don't overwhelm the main content.
- Shape Builder Tool: Use this tool (Shift+M) to merge or subtract shapes for unique designs.
- Adding Circles: Use the Ellipse Tool (L) to create circles of varying sizes and positions.
- Using the Pen Tool: Draw wavy paths with the Pen Tool (P) for a liquid effect.
- Adding a Rectangle Shape: Place a rectangle behind your wavy paths to use with the Shape Builder Tool.
- Selecting All Shape Paths: Use the Path Selection Tool (A) and the Shape Builder Tool (Shift+M) to refine your design.
- Refining Circle Placement: Adjust circle size and position for a balanced layout.
- Anchor Points: Customize circles with different anchor point shapes for added style.
These techniques will help you create a background that enhances your infographic's content and visual impact.
Creating a Compelling Drink Illustration
Illustrations can bring your infographics to life. Here's how to create a drink illustration that tells a visual story:
- Base Shape: Use the Rectangle Tool (M) to draw the glass or mug, refining it to match your desired style.
- Adding the Stand and Base: Use the Ellipse Tool (L) for the base, and adjust with the Direct Selection Tool (A) for a rounded look.
- Creating Drink Foam/Head: Draw foam with the Pen Tool (P) at the top of the glass.
- Add Some Bubbles: Use the Ellipse Tool (L) to add bubbles inside the drink.
- Straws: Create a straw using the Rectangle Tool (M).
- Adding Highlights and Shadows: Use transparency adjustments to add depth and realism.
These steps will help you craft detailed and engaging infographics.
Step-by-Step Guide to Create Awesome Visuals
Step 1: Laying the Base Layers of Our Design
Begin by creating a background using the Rectangle Tool (M), followed by liquid pathways with the Pen Tool and refining them with the Shape Builder Tool.
Step 2: Creating Our Mug Infographics
After setting the base, create a standout mug illustration using the Rectangle Tool and custom modifications for a 3D effect.
Step 3: Linking Data Connections to the Images
Data is crucial. Use circles and rectangles to visually connect your data points to the images, adding context to your design.
Step 4: Finishing Touches
Finalize your design by applying colors from your base design and aligning all elements using Illustrator's alignment tools.
Adobe Illustrator Pricing Plans
Understanding Adobe Illustrator's Subscription Model
Adobe Illustrator operates on a subscription-based model, offering various plans to meet different user needs. These plans are part of the Adobe Creative Cloud suite, ensuring you always have the latest features and updates. Pricing varies based on subscription duration and whether you bundle it with other Adobe apps. For the most current pricing, check Adobe's official website.
Individual Plans
- Illustrator Single App: Perfect for dedicated Illustrator users, including 100GB of cloud storage, Adobe Fonts, and Behance integration.
- Creative Cloud All Apps: Ideal for professionals needing multiple Adobe apps, offering over 20 apps and 100GB of cloud storage.
Business Plans
- Illustrator for Teams: Designed for businesses requiring multiple licenses, with centralized administration and collaborative features.
- Creative Cloud for Teams: Provides access to all Creative Cloud apps for team use, with additional collaboration tools.
Student and Teacher Plans
- Creative Cloud for Students and Teachers: A discounted plan for eligible students and educators, providing access to all Creative Cloud apps at a reduced price.
Here's a simplified breakdown of the pricing structure:
| Plan | Description | Key Features |
|---|---|---|
| Illustrator Single App | Best for individual Illustrator users | 100GB cloud storage, Adobe Fonts, Behance integration |
| Creative Cloud All Apps | Comprehensive access to all Adobe apps for individuals | Access to over 20 apps, 100GB cloud storage, Adobe Fonts, Behance integration |
| Illustrator for Teams | For businesses needing Illustrator licenses | Centralized administration, advanced support, collaborative features |
| Creative Cloud for Teams | Comprehensive access to all Adobe apps for teams | All Creative Cloud apps, centralized administration, advanced support, collaborative features |
| Creative Cloud for Students/Teachers | Discounted access to all Creative Cloud apps for eligible students/teachers | Access to over 20 apps at a reduced price, subject to eligibility verification |
When choosing a plan, consider your specific design needs and how often you'll use the software. The single app plan is great for focused Illustrator users, while the all apps plan suits those working on varied projects.
Adobe Illustrator for Infographics: Weighing the Pros and Cons
Pros
- High-Quality Vector Graphics: Allows designs to scale without quality loss.
- Precise Typography Controls: Extensive options for text formatting.
- Versatile Shape and Path Tools: Enables custom illustrations and graphics.
- Advanced Color Management: Facilitates consistent and harmonious color schemes.
- Seamless Integration: Works well with other Adobe Creative Cloud applications.
Cons
- Steep Learning Curve: Can be challenging for beginners to master.
- Subscription-Based Pricing: Requires ongoing payments, which may not suit everyone.
- Resource-Intensive: May need powerful hardware for complex designs.
- Not Ideal for Heavy Data Visualization: Primarily a graphic design tool, not a dedicated data visualization platform.
- Overwhelming Number of Features: Can be difficult to navigate and use effectively.
Adobe Illustrator Core Features for Infographic Design
Key Features That Make Illustrator Ideal for Infographics
Adobe Illustrator is packed with features that make it perfect for infographic design. Here are some key tools:
- Vector Graphics: Illustrator's vector capabilities mean your designs can scale without losing quality.
This is vital for infographics that need to be viewed at various sizes. - Typography Tools: Fine-tune your text with robust typography options, adjusting font styles, sizes, and spacing for clear and appealing layouts.
- Shape and Path Tools: Use the Pen Tool, Shape Builder Tool, and Pathfinder panel to create and refine custom graphics with precision.
- Color Management: Manage color schemes easily with the Swatches and Color Guide panels, ensuring design consistency.
- Data Visualization: While not a primary data tool, Illustrator can import and customize charts and graphs, helping you visually represent data.
- Layers: Organize design elements using layers, making it easier to edit and manage complex designs.
Real-World Use Cases for Infographics
Diverse Applications of Infographics Across Industries
Infographics are incredibly versatile, used across various industries for different purposes:
- Marketing and Advertising: Use infographics to showcase product features, customer testimonials, and market trends. Companies like HubSpot and Neil Patel Digital use them to drive traffic and generate leads.
- Education: Simplify complex subjects for students. Teachers and institutions use them to explain scientific concepts, historical timelines, and more.
- Journalism: Enhance news articles with data-driven infographics. Media outlets like The New York Times and The Guardian use them to provide context on current events.
- Healthcare: Communicate medical information and health statistics clearly. Organizations like the Mayo Clinic and the CDC use infographics for public health awareness.
- Business and Finance: Illustrate financial data and business strategies. Companies use them in annual reports and presentations to aid decision-making.
- Non-Profit Organizations: Raise awareness about social issues and showcase campaign impacts. Non-profits like UNICEF and the World Wildlife Fund use infographics to engage donors and the public.
| Industry | Use Case | Example Application |
|---|---|---|
| Marketing & Ads | Present product features, testimonials, trends | HubSpot uses infographics to explain inbound marketing strategies and generate leads. |
| Education | Simplify complex subjects, timelines, principles | Teachers use infographics to break down scientific concepts and historical events for students. |
| Journalism | Enhance news articles and reports with data-driven visuals | The New York Times uses infographics to provide context and insights into current events and complex issues. |
| Healthcare | Communicate medical information, treatment options, stats | Mayo Clinic uses infographics to educate patients about diseases, treatment options, and preventive healthcare measures. |
| Business & Finance | Illustrate financial data, strategies, performance | Companies use infographics in annual reports and presentations to highlight key financial metrics and business strategies. |
| Non-Profits | Raise awareness, showcase impact, communicate goals | UNICEF uses infographics to raise awareness about children’s rights and showcase the impact of their programs on a global scale. |
Understanding these applications helps you tailor your infographic designs to meet specific industry needs and goals.
Frequently Asked Questions (FAQ)
What are the best Adobe Illustrator tools for creating infographics?
Adobe Illustrator offers several tools that are particularly useful for infographic design. These include the Pen Tool (P) for custom shapes, the Shape Builder Tool (Shift+M) for merging shapes, the Type Tool (T) for text formatting, and the Graph tools for data visualization. The Pathfinder and Align panels are also essential for precise editing and layout.
How can I ensure my infographic is visually appealing and easy to read?
To make your infographic visually appealing and easy to read, focus on visual hierarchy, contrast, and white space. Use size, color, and placement to highlight important information. Maintain high contrast for readability, avoid overcrowding, and keep consistency in typography and visuals to guide viewers through your story.
What are the ideal dimensions for an infographic?
The ideal dimensions depend on your infographic's intended use. Common sizes include:
- Standard: 800 x 2000 pixels
- Tall: 800 x 3000 pixels
- Wide: 1200 x 1800 pixels
How do I export my infographic for different platforms?
When exporting, consider the platform. For web, save as PNG or JPEG at 72 DPI for quick loading. For print, use PDF at 300 DPI for high-quality output. Adjust settings to meet each platform's requirements.
Related Questions
How can I add a background to my infographic in Adobe Illustrator?
Adding a background in Adobe Illustrator involves several steps to enhance your infographic's visual appeal without overshadowing the content. Start with the Rectangle Tool (M) to cover the artboard, then apply a subtle gradient using the Gradient panel. Add shapes and lines, adjusting their opacity to complement your design. Use the Shape Builder Tool (Shift+M) to create unique patterns by merging or subtracting shapes. Add circles with the Ellipse Tool for balance, and adjust their colors and blend modes for cohesion. For a dynamic effect, consider adding textured overlays or patterns. Always ensure the background complements your infographic's theme without distracting from the main data.


 Convert Videos to Text Effortlessly: No Typing Required
Ever found yourself in a situation where you need to transcribe a long video, but the thought of typing out every word is daunting? Whether it's a two-hour lecture or a critical business meeting recording, many of us face this challenge. But fear not! This article is here to introduce you to a hassl
Convert Videos to Text Effortlessly: No Typing Required
Ever found yourself in a situation where you need to transcribe a long video, but the thought of typing out every word is daunting? Whether it's a two-hour lecture or a critical business meeting recording, many of us face this challenge. But fear not! This article is here to introduce you to a hassl
 Terminator Future War: Advanced Tech & Survival Strategies
The chilling vision of the Terminator future war, where humanity struggles against a relentless robotic enemy, continues to captivate and inspire strategic thinking. This blog delves into the advanced technology and desperate survival strategies that define this dystopian conflict. By exploring thes
Terminator Future War: Advanced Tech & Survival Strategies
The chilling vision of the Terminator future war, where humanity struggles against a relentless robotic enemy, continues to captivate and inspire strategic thinking. This blog delves into the advanced technology and desperate survival strategies that define this dystopian conflict. By exploring thes
 Minecraft Village Exploration: Trading, Farming, and Resource Gathering
Exploring the Heart of Minecraft: VillagesMinecraft villages are more than just a collection of buildings; they're vibrant communities brimming with life and opportunities. Whether you're a seasoned player or just starting out, these villages offer a safe haven, a place to gather resources, and a ch
Minecraft Village Exploration: Trading, Farming, and Resource Gathering
Exploring the Heart of Minecraft: VillagesMinecraft villages are more than just a collection of buildings; they're vibrant communities brimming with life and opportunities. Whether you're a seasoned player or just starting out, these villages offer a safe haven, a place to gather resources, and a ch