Create a Stunning Infographic Design in Adobe Illustrator

 April 28, 2025

 StephenPerez

 9
9
Infographics are a fantastic way to present complex information in a visually engaging and easy-to-understand format. Using Adobe Illustrator, you can craft professional and eye-catching infographics that not only grab attention but also effectively communicate your message. This guide will walk you through a comprehensive, step-by-step process on how to design an infographic using Adobe Illustrator, from setting up your document to adding the final touches. Discover how to leverage Adobe Illustrator's features to create infographics that are both compelling and informative.
Key Points
- Understand the principles of effective infographic design.
- Set up your document correctly in Adobe Illustrator.
- Create and arrange basic shapes effectively.
- Enhance visual appeal with color palettes.
- Use icons and images to support your message.
- Add text and data visualizations for clarity.
- Apply effects like drop shadows for added depth.
- Ensure visual balance and readability.
- Export your infographic in a suitable format for sharing.
Designing an Infographic with Adobe Illustrator: A Step-by-Step Guide
Getting Started: Setting Up Your Document
The first step in creating a stunning infographic is setting up your document correctly in Adobe Illustrator. Proper setup ensures your design retains its quality and clarity when shared. Here’s how to do it:
- Open Adobe Illustrator on your computer.
- Go to File > New to create a new document.
- In the New Document dialog box, set the following:
- Name: Give your document a descriptive name, like “Infographic_Design”.
- Profile: Choose “Print” for print media or “Web” for online use. This adjusts the color mode.
- Number of Artboards: Set to 1 for a single infographic.
- Size: Common sizes include 8.5 x 11 inches (US Letter) or A4 (210 x 297 mm) for print, and 800 x 2000 pixels for web. Adjust the height based on your content.
- Units: Choose inches, millimeters, or pixels based on your medium.
- Orientation: Opt for “portrait” for a vertical layout.
- Color Mode: CMYK for print, RGB for web.
- Raster Effects: Set to 300 ppi for print or 72 ppi for web.
- Preview Mode: Keep it on “Default”.
- Click “Create” to set up your document with these settings.
With these initial settings, you'll have a workspace optimized for infographic design, ensuring your final product is high-quality and appropriate for its intended use. This solid foundation is key to creating a visually stunning and effective infographic in Adobe Illustrator.
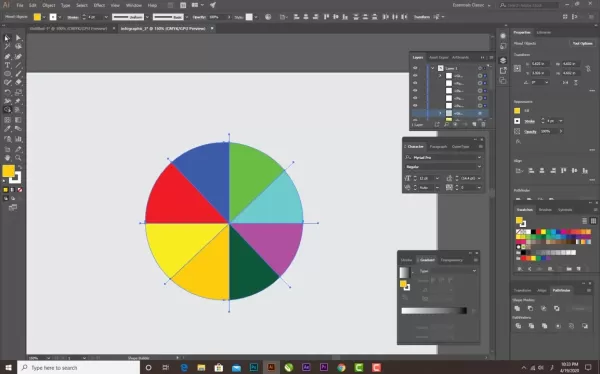
Creating Basic Shapes and Layout
Once your document is set up, it's time to create the basic shapes that will form the structure of your infographic. These shapes act as containers for your content, guiding the viewer's eye and organizing the information. Here’s how to get started:
- Select the Rectangle Tool (M) from the toolbar.
- Click and drag on the artboard to draw a rectangle. You can set exact dimensions in the Properties panel if needed.
- Adjust the fill and stroke colors in the Properties panel. For instance, set the fill to yellow and the stroke to none.
- Unlock the rectangle to ensure it stays put during your design process.
- Select the Ellipse Tool (L) and draw a circle on the artboard.
- Adjust the circle’s size by dragging its corner handles while holding the Shift key to keep proportions.
- Change the fill color of the circle to grey; this will be the base of your design.
- Copy (Ctrl+C) and paste (Ctrl+F) the circle to create an exact copy on top.
- Resize the copied circle by dragging its corner handles while holding Shift, creating a concentric circle.
- Add a drop shadow to the larger circle by going to Effect > Stylize > Drop Shadow. Adjust settings to create a subtle depth effect.
- Draw a smaller ellipse inside the concentric circles; this will be your central element.
- Set the fill color of the new ellipse to yellow.
- Copy and paste lines to create sections in your design.
By carefully laying out these foundational elements, you can effectively communicate your data. A well-thought-out layout and composition make your infographic both visually appealing and easy to understand using Adobe Illustrator.
Advanced Techniques for a Polished Infographic
Adding and Manipulating Icons
Icons play a crucial role in infographic design, providing visual cues that complement your text and data. Here's how to incorporate and manipulate icons in Adobe Illustrator:
- Find icons relevant to your data on websites like Font Awesome, The Noun Project, or Flaticon.
- Import the icons into your document by dragging and dropping them onto your artboard or using File > Place.
- Customize the icons:
- Color: Change the icon colors to match your infographic's scheme using the Color Picker or Swatches panel.
- Size and Position: Adjust the icons' size and position to fit within your design, ensuring they align with the relevant text or data.
- Grouping: Group related icons to manage them as a single unit, making it easier to move, scale, and align them.
- Create icon buttons by grouping and pasting them in front for easy editing alongside your sections.
- Use icons sparingly to complement, not clutter, your design. Consistency in style and color helps maintain a cohesive look.
Mastering icon manipulation enhances your infographic's visual communication, making it more engaging and informative. With Adobe Illustrator, you can create infographics that are both compelling and clear.
Creating Sections with Lines
Copy and Transform Lines
After setting up your document, the next step is to copy and transform lines. Use the rotate function to separate your chart into different sections, creating a structured and organized infographic.
Adobe Illustrator Pricing Plans
Understanding Subscription Options
Adobe Illustrator is available through various subscription plans, each tailored to different user needs and budgets. Here’s a breakdown of the options:
- Single App Plan: Access to Adobe Illustrator only, perfect for focused design tasks.
- Monthly: $20.99/month
- Annual, paid monthly: $239.88/year ($19.99/month)
- Annual, prepaid: $239.88/year
- All Apps Plan (Creative Cloud): Access to over 20 Adobe apps, including Illustrator, Photoshop, and InDesign, ideal for professionals needing a broad toolset.
- Monthly: $82.49/month
- Annual, paid monthly: $59.99/month
- Annual, prepaid: $695.88/year
- For Students and Teachers: Discounted rates for access to the Creative Cloud All Apps plan.
- Annual, paid monthly: $19.99/month
- Prepaid: $239.88/year
- Business Plans: Tailored plans for businesses with additional features like collaboration tools and advanced support.
- Illustrator single app: $35.99/month
- Creative Cloud all apps: $84.99/month
- Free Trial: A 7-day free trial of Adobe Illustrator allows you to test its features before committing to a subscription.
Selecting the right plan impacts your budget and workflow. Consider your design needs and choose a plan that balances features and cost-effectiveness for your projects.
Adobe Illustrator: Weighing the Pros and Cons
Pros
- Exceptional Vector Graphics: Adobe Illustrator's vector environment ensures crisp designs at any scale.
- Precise Control: Offers fine control over design elements like shapes, paths, typography, and color.
- Versatile Design Tools: Includes tools like the Pen Tool, Shape Tools, and Type Tool for intricate, customized designs.
- Extensive Typography Options: Control over fonts, sizes, spacing, and alignment enhances readability and appeal.
- Robust Color Management: Features custom color palettes and gradients for rich visual designs.
- Seamless Integration: Works seamlessly with other Adobe Creative Cloud apps, improving workflow.
- Professional Output: High-quality output options for both print and web.
- Creative Cloud Ecosystem: Access to Adobe Fonts, Behance, and other creative tools as part of the Creative Cloud.
Cons
- Steep Learning Curve: Can be challenging for beginners to master.
- Subscription-Based: Requires ongoing payments, which can be costly.
- Resource-Intensive: Needs a powerful computer to run efficiently.
- Complexity: Managing large, intricate designs can become complex.
Key Features of Adobe Illustrator for Infographic Design
Adobe Illustrator's Powerful Tools
Adobe Illustrator is packed with features that make it ideal for creating stunning infographics. Here are some of its key capabilities:
- Vector Graphics: Creates graphics using mathematical equations, ensuring crispness at any size, perfect for versatile infographics.
- Shape Tools: Offers rectangles, ellipses, polygons, and stars for basic and complex shapes in your design.
- Pen Tool: Allows precise path creation for custom illustrations and intricate designs.
- Type Tool: Essential for adding text with extensive control over font, size, spacing, and alignment.
- Color Tools: Robust color management with custom palettes and gradients to enhance visual appeal.
- Gradients: Enhances backgrounds and adds a polished look to your infographic design.
- Layers: Organizes design elements for easy management and editing.
- Effects: Offers drop shadows, glows, and blurs to add depth and dimension.
- Alignment and Distribution: Ensures precise alignment and even spacing for a professional look.
- Export Options: Supports various formats like PNG, JPEG, PDF, and SVG for different uses.
Diverse Use Cases for Infographic Designs
Maximize Your Communication with Infographics
Infographics are versatile tools used across various industries and scenarios. Here are some common applications:
- Marketing: Used by businesses to promote products, highlight features, and share testimonials on social media and websites.
- Education: Simplifies complex topics for educators, used in classrooms and online courses.
- Journalism: Visualizes data and timelines to make news stories more digestible for readers.
- Government and Non-profits: Raises awareness about health, environmental, and social issues through public campaigns.
- Data Visualization: Helps data scientists and analysts present research and statistics in a visually compelling way.
- Internal Communication: Companies use infographics for internal policies, training, and project updates.
- Presentations: Enhances presentations by making data more engaging for audiences, useful in meetings and conferences.
Frequently Asked Questions
What is the best software for creating infographics?
Adobe Illustrator, Adobe InDesign, and Canva are popular choices. Adobe Illustrator is favored for its vector graphics tools, while Canva is known for its user-friendly templates.
What are the key elements of an effective infographic?
An effective infographic should have a clear focus, compelling visuals, accurate data, a logical flow, and a concise message. It should also be visually balanced and easy to read.
How do I choose the right color palette for my infographic?
Select a color palette that's visually appealing and aligns with your brand or message. Use color theory for harmonious combinations and ensure sufficient contrast for readability.
What is the ideal size for an infographic?
The ideal size depends on its use. For print, common sizes are 8.5 x 11 inches (US Letter) or A4. For web, a typical width is 800 pixels, with height adjusted based on content.
How can I ensure my infographic is accessible?
Ensure accessibility by using sufficient contrast, providing alternative text for images, using clear language, structuring content logically, and exporting as a tagged PDF for screen readers.
How often should I update my infographics?
Update infographics whenever there are significant changes to the data, information, or branding they represent. Regular updates keep them accurate and relevant.
Related Questions
What are some common mistakes to avoid when designing infographics?
When crafting infographics, avoid overcrowding with text or data, inconsistent use of fonts and colors, unclear objectives, ignoring your target audience, failing to cite sources, poor layout structure, low-quality visuals, neglecting mobile optimization, neglecting to proofread, and not optimizing for search engines. By steering clear of these pitfalls, you can create a clear, visually appealing, and effective infographic using Adobe Illustrator.
Related article
 PixVerse AI Video Generator: Unleash Your Creative Potential
In today's fast-paced digital world, video content has taken the throne. Whether you're a seasoned marketer, an aspiring content creator, or just someone eager to share a story, the ability to craft high-quality videos is invaluable. That's where PixVerse AI steps in, offering a revolutionary platfo
Boost Your Earnings: Provide Travel Planning Services on Fiverr
Do you find joy in exploring new destinations and meticulously crafting travel itineraries? Why not transform that passion into a profitable venture by offering travel planning services on Fiverr? It's no secret that many people crave the excitement of travel but often find themselves short on time
Diving Deep into Hollow Sky's Dreamy Soundscapes: An Exploration
Discovering the Essence of Hollow Sky: A Musical JourneyHollow Sky isn't just another name in the music scene; it's an immersive experience that captivates listeners. With its haunting melodies intertwined with deeply introspective lyrics, Hollow Sky crafts an environment where fans can truly lose t
Comments (0)
0/200
PixVerse AI Video Generator: Unleash Your Creative Potential
In today's fast-paced digital world, video content has taken the throne. Whether you're a seasoned marketer, an aspiring content creator, or just someone eager to share a story, the ability to craft high-quality videos is invaluable. That's where PixVerse AI steps in, offering a revolutionary platfo
Boost Your Earnings: Provide Travel Planning Services on Fiverr
Do you find joy in exploring new destinations and meticulously crafting travel itineraries? Why not transform that passion into a profitable venture by offering travel planning services on Fiverr? It's no secret that many people crave the excitement of travel but often find themselves short on time
Diving Deep into Hollow Sky's Dreamy Soundscapes: An Exploration
Discovering the Essence of Hollow Sky: A Musical JourneyHollow Sky isn't just another name in the music scene; it's an immersive experience that captivates listeners. With its haunting melodies intertwined with deeply introspective lyrics, Hollow Sky crafts an environment where fans can truly lose t
Comments (0)
0/200
April 28, 2025
StephenPerez
9
Infographics are a fantastic way to present complex information in a visually engaging and easy-to-understand format. Using Adobe Illustrator, you can craft professional and eye-catching infographics that not only grab attention but also effectively communicate your message. This guide will walk you through a comprehensive, step-by-step process on how to design an infographic using Adobe Illustrator, from setting up your document to adding the final touches. Discover how to leverage Adobe Illustrator's features to create infographics that are both compelling and informative.
Key Points
- Understand the principles of effective infographic design.
- Set up your document correctly in Adobe Illustrator.
- Create and arrange basic shapes effectively.
- Enhance visual appeal with color palettes.
- Use icons and images to support your message.
- Add text and data visualizations for clarity.
- Apply effects like drop shadows for added depth.
- Ensure visual balance and readability.
- Export your infographic in a suitable format for sharing.
Designing an Infographic with Adobe Illustrator: A Step-by-Step Guide
Getting Started: Setting Up Your Document
The first step in creating a stunning infographic is setting up your document correctly in Adobe Illustrator. Proper setup ensures your design retains its quality and clarity when shared. Here’s how to do it:
- Open Adobe Illustrator on your computer.
- Go to File > New to create a new document.
- In the New Document dialog box, set the following:
- Name: Give your document a descriptive name, like “Infographic_Design”.
- Profile: Choose “Print” for print media or “Web” for online use. This adjusts the color mode.
- Number of Artboards: Set to 1 for a single infographic.
- Size: Common sizes include 8.5 x 11 inches (US Letter) or A4 (210 x 297 mm) for print, and 800 x 2000 pixels for web. Adjust the height based on your content.
- Units: Choose inches, millimeters, or pixels based on your medium.
- Orientation: Opt for “portrait” for a vertical layout.
- Color Mode: CMYK for print, RGB for web.
- Raster Effects: Set to 300 ppi for print or 72 ppi for web.
- Preview Mode: Keep it on “Default”.
- Click “Create” to set up your document with these settings.
With these initial settings, you'll have a workspace optimized for infographic design, ensuring your final product is high-quality and appropriate for its intended use. This solid foundation is key to creating a visually stunning and effective infographic in Adobe Illustrator.
Creating Basic Shapes and Layout
Once your document is set up, it's time to create the basic shapes that will form the structure of your infographic. These shapes act as containers for your content, guiding the viewer's eye and organizing the information. Here’s how to get started:
- Select the Rectangle Tool (M) from the toolbar.
- Click and drag on the artboard to draw a rectangle. You can set exact dimensions in the Properties panel if needed.
- Adjust the fill and stroke colors in the Properties panel. For instance, set the fill to yellow and the stroke to none.
- Unlock the rectangle to ensure it stays put during your design process.
- Select the Ellipse Tool (L) and draw a circle on the artboard.
- Adjust the circle’s size by dragging its corner handles while holding the Shift key to keep proportions.
- Change the fill color of the circle to grey; this will be the base of your design.
- Copy (Ctrl+C) and paste (Ctrl+F) the circle to create an exact copy on top.
- Resize the copied circle by dragging its corner handles while holding Shift, creating a concentric circle.
- Add a drop shadow to the larger circle by going to Effect > Stylize > Drop Shadow. Adjust settings to create a subtle depth effect.
- Draw a smaller ellipse inside the concentric circles; this will be your central element.
- Set the fill color of the new ellipse to yellow.
- Copy and paste lines to create sections in your design.
By carefully laying out these foundational elements, you can effectively communicate your data. A well-thought-out layout and composition make your infographic both visually appealing and easy to understand using Adobe Illustrator.
Advanced Techniques for a Polished Infographic
Adding and Manipulating Icons
Icons play a crucial role in infographic design, providing visual cues that complement your text and data. Here's how to incorporate and manipulate icons in Adobe Illustrator:
- Find icons relevant to your data on websites like Font Awesome, The Noun Project, or Flaticon.
- Import the icons into your document by dragging and dropping them onto your artboard or using File > Place.
- Customize the icons:
- Color: Change the icon colors to match your infographic's scheme using the Color Picker or Swatches panel.
- Size and Position: Adjust the icons' size and position to fit within your design, ensuring they align with the relevant text or data.
- Grouping: Group related icons to manage them as a single unit, making it easier to move, scale, and align them.
- Create icon buttons by grouping and pasting them in front for easy editing alongside your sections.
- Use icons sparingly to complement, not clutter, your design. Consistency in style and color helps maintain a cohesive look.
Mastering icon manipulation enhances your infographic's visual communication, making it more engaging and informative. With Adobe Illustrator, you can create infographics that are both compelling and clear.
Creating Sections with Lines
Copy and Transform Lines
After setting up your document, the next step is to copy and transform lines. Use the rotate function to separate your chart into different sections, creating a structured and organized infographic.
Adobe Illustrator Pricing Plans
Understanding Subscription Options
Adobe Illustrator is available through various subscription plans, each tailored to different user needs and budgets. Here’s a breakdown of the options:
- Single App Plan: Access to Adobe Illustrator only, perfect for focused design tasks.
- Monthly: $20.99/month
- Annual, paid monthly: $239.88/year ($19.99/month)
- Annual, prepaid: $239.88/year
- All Apps Plan (Creative Cloud): Access to over 20 Adobe apps, including Illustrator, Photoshop, and InDesign, ideal for professionals needing a broad toolset.
- Monthly: $82.49/month
- Annual, paid monthly: $59.99/month
- Annual, prepaid: $695.88/year
- For Students and Teachers: Discounted rates for access to the Creative Cloud All Apps plan.
- Annual, paid monthly: $19.99/month
- Prepaid: $239.88/year
- Business Plans: Tailored plans for businesses with additional features like collaboration tools and advanced support.
- Illustrator single app: $35.99/month
- Creative Cloud all apps: $84.99/month
- Free Trial: A 7-day free trial of Adobe Illustrator allows you to test its features before committing to a subscription.
Selecting the right plan impacts your budget and workflow. Consider your design needs and choose a plan that balances features and cost-effectiveness for your projects.
Adobe Illustrator: Weighing the Pros and Cons
Pros
- Exceptional Vector Graphics: Adobe Illustrator's vector environment ensures crisp designs at any scale.
- Precise Control: Offers fine control over design elements like shapes, paths, typography, and color.
- Versatile Design Tools: Includes tools like the Pen Tool, Shape Tools, and Type Tool for intricate, customized designs.
- Extensive Typography Options: Control over fonts, sizes, spacing, and alignment enhances readability and appeal.
- Robust Color Management: Features custom color palettes and gradients for rich visual designs.
- Seamless Integration: Works seamlessly with other Adobe Creative Cloud apps, improving workflow.
- Professional Output: High-quality output options for both print and web.
- Creative Cloud Ecosystem: Access to Adobe Fonts, Behance, and other creative tools as part of the Creative Cloud.
Cons
- Steep Learning Curve: Can be challenging for beginners to master.
- Subscription-Based: Requires ongoing payments, which can be costly.
- Resource-Intensive: Needs a powerful computer to run efficiently.
- Complexity: Managing large, intricate designs can become complex.
Key Features of Adobe Illustrator for Infographic Design
Adobe Illustrator's Powerful Tools
Adobe Illustrator is packed with features that make it ideal for creating stunning infographics. Here are some of its key capabilities:
- Vector Graphics: Creates graphics using mathematical equations, ensuring crispness at any size, perfect for versatile infographics.
- Shape Tools: Offers rectangles, ellipses, polygons, and stars for basic and complex shapes in your design.
- Pen Tool: Allows precise path creation for custom illustrations and intricate designs.
- Type Tool: Essential for adding text with extensive control over font, size, spacing, and alignment.
- Color Tools: Robust color management with custom palettes and gradients to enhance visual appeal.
- Gradients: Enhances backgrounds and adds a polished look to your infographic design.
- Layers: Organizes design elements for easy management and editing.
- Effects: Offers drop shadows, glows, and blurs to add depth and dimension.
- Alignment and Distribution: Ensures precise alignment and even spacing for a professional look.
- Export Options: Supports various formats like PNG, JPEG, PDF, and SVG for different uses.
Diverse Use Cases for Infographic Designs
Maximize Your Communication with Infographics
Infographics are versatile tools used across various industries and scenarios. Here are some common applications:
- Marketing: Used by businesses to promote products, highlight features, and share testimonials on social media and websites.
- Education: Simplifies complex topics for educators, used in classrooms and online courses.
- Journalism: Visualizes data and timelines to make news stories more digestible for readers.
- Government and Non-profits: Raises awareness about health, environmental, and social issues through public campaigns.
- Data Visualization: Helps data scientists and analysts present research and statistics in a visually compelling way.
- Internal Communication: Companies use infographics for internal policies, training, and project updates.
- Presentations: Enhances presentations by making data more engaging for audiences, useful in meetings and conferences.
Frequently Asked Questions
What is the best software for creating infographics?
Adobe Illustrator, Adobe InDesign, and Canva are popular choices. Adobe Illustrator is favored for its vector graphics tools, while Canva is known for its user-friendly templates.
What are the key elements of an effective infographic?
An effective infographic should have a clear focus, compelling visuals, accurate data, a logical flow, and a concise message. It should also be visually balanced and easy to read.
How do I choose the right color palette for my infographic?
Select a color palette that's visually appealing and aligns with your brand or message. Use color theory for harmonious combinations and ensure sufficient contrast for readability.
What is the ideal size for an infographic?
The ideal size depends on its use. For print, common sizes are 8.5 x 11 inches (US Letter) or A4. For web, a typical width is 800 pixels, with height adjusted based on content.
How can I ensure my infographic is accessible?
Ensure accessibility by using sufficient contrast, providing alternative text for images, using clear language, structuring content logically, and exporting as a tagged PDF for screen readers.
How often should I update my infographics?
Update infographics whenever there are significant changes to the data, information, or branding they represent. Regular updates keep them accurate and relevant.
Related Questions
What are some common mistakes to avoid when designing infographics?
When crafting infographics, avoid overcrowding with text or data, inconsistent use of fonts and colors, unclear objectives, ignoring your target audience, failing to cite sources, poor layout structure, low-quality visuals, neglecting mobile optimization, neglecting to proofread, and not optimizing for search engines. By steering clear of these pitfalls, you can create a clear, visually appealing, and effective infographic using Adobe Illustrator.


 PixVerse AI Video Generator: Unleash Your Creative Potential
In today's fast-paced digital world, video content has taken the throne. Whether you're a seasoned marketer, an aspiring content creator, or just someone eager to share a story, the ability to craft high-quality videos is invaluable. That's where PixVerse AI steps in, offering a revolutionary platfo
PixVerse AI Video Generator: Unleash Your Creative Potential
In today's fast-paced digital world, video content has taken the throne. Whether you're a seasoned marketer, an aspiring content creator, or just someone eager to share a story, the ability to craft high-quality videos is invaluable. That's where PixVerse AI steps in, offering a revolutionary platfo
 Boost Your Earnings: Provide Travel Planning Services on Fiverr
Do you find joy in exploring new destinations and meticulously crafting travel itineraries? Why not transform that passion into a profitable venture by offering travel planning services on Fiverr? It's no secret that many people crave the excitement of travel but often find themselves short on time
Boost Your Earnings: Provide Travel Planning Services on Fiverr
Do you find joy in exploring new destinations and meticulously crafting travel itineraries? Why not transform that passion into a profitable venture by offering travel planning services on Fiverr? It's no secret that many people crave the excitement of travel but often find themselves short on time
 Diving Deep into Hollow Sky's Dreamy Soundscapes: An Exploration
Discovering the Essence of Hollow Sky: A Musical JourneyHollow Sky isn't just another name in the music scene; it's an immersive experience that captivates listeners. With its haunting melodies intertwined with deeply introspective lyrics, Hollow Sky crafts an environment where fans can truly lose t
Diving Deep into Hollow Sky's Dreamy Soundscapes: An Exploration
Discovering the Essence of Hollow Sky: A Musical JourneyHollow Sky isn't just another name in the music scene; it's an immersive experience that captivates listeners. With its haunting melodies intertwined with deeply introspective lyrics, Hollow Sky crafts an environment where fans can truly lose t