Create Engaging Infographics with Adobe Illustrator: A Step-by-Step Guide

 May 2, 2025

 RobertLewis

 2
2
In today's fast-paced digital world, infographics have become an essential tool for breaking down complex information into visually engaging, easy-to-understand formats. Adobe Illustrator, with its powerful vector graphics capabilities, is a top choice for designers looking to craft stunning infographics. This guide will take you through the journey of creating an impactful infographic, highlighting practical techniques and design principles in Adobe Illustrator.
Key Points for Crafting Effective Infographics
Creating an infographic that resonates with your audience involves more than just throwing data onto a page. Here are some essential tips to keep in mind:
- Know Your Audience: Tailor your design to meet the interests and needs of your specific audience.
- Set a Clear Objective: Define what message or story you want your infographic to convey.
- Organize Your Data: Gather and structure your data in a way that supports your narrative.
- Choose the Right Visuals: Select visualizations that accurately represent your data and enhance understanding.
- Design a Cohesive Layout: Arrange your elements to guide the reader through the information smoothly.
- Maintain Consistency: Ensure a uniform design style throughout your infographic to keep it professional.
- Use Color Wisely: Employ colors to highlight important points and add visual interest.
- Focus on Readability: Choose fonts and sizes that are easy to read and enhance the overall design.
- Optimize for Sharing: Make sure your infographic is ready for various platforms and easy to share.
- Cite Your Sources: Always give credit to your data sources to maintain credibility.
Getting Started with Infographic Design in Adobe Illustrator
Setting Up Your Adobe Illustrator Document for Infographics
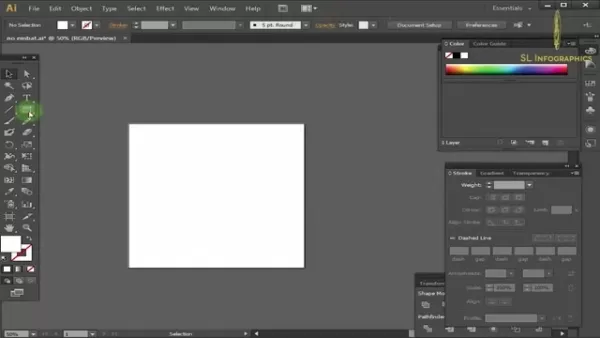
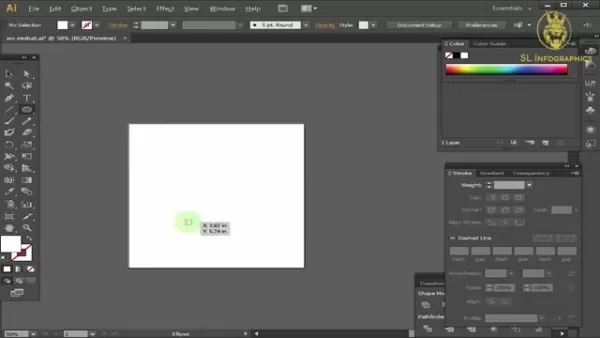
Before you dive into the creative process, setting up your Adobe Illustrator document correctly is crucial. This step ensures your infographic is formatted properly for its intended use and maintains high visual quality. Here's how to get started:
- Create a New Document: Launch Adobe Illustrator, go to File > New, and set up your infographic's parameters in the 'New Document' window.
- Select the Right Profile: Choose the 'Web' profile for infographics intended for online viewing, which sets the color mode to RGB. For print, select the 'Print' profile, which uses CMYK.
- Define the Artboard Size: Pick a size that suits your content and viewing platform. Common sizes include Letter (8.5 x 11 inches), Legal (8.5 x 14 inches), or custom sizes based on your needs.
- Understand Color Mode: Use RGB for digital displays and CMYK for print to ensure color accuracy.
- Adjust Units: Set your units of measurement (inches, pixels, etc.) for consistency and ease of use.
- Save Your Project: Early on, save your document by navigating to File > Save As, naming your file, and choosing Adobe Illustrator (*.AI) format to keep all elements editable.
Basic Shapes & Tools in Adobe Illustrator for Infographics
Adobe Illustrator provides a range of tools perfect for creating the visual elements of your infographic. Mastering these tools is key to producing engaging and informative visuals:
- Rectangle Tool: Ideal for creating borders, backgrounds, and simple visual elements.
- Ellipse Tool: Useful for charts, diagrams, and other circular or elliptical representations.
- Polygon Tool: Creates unique shapes with a specified number of sides for visual accents.
- Line Segment Tool: Draws straight lines, essential for timelines, connectors, and dividers.
- Pen Tool: Enables the creation of precise custom shapes by defining anchor points and paths.
- Rotate Tool: Allows you to rotate elements to the desired angle.
Key Design Elements: Shapes, Lines, and Typography
When designing an infographic, consider these essential design elements to ensure clarity and visual appeal:
- Shapes: Use shapes to represent data, create visual containers, and add structure to your layout. Different shapes can highlight various sections and key information.
- Lines: Employ lines to connect elements, guide the viewer's eye, and emphasize relationships. Vary line thickness and style to denote importance or connection.
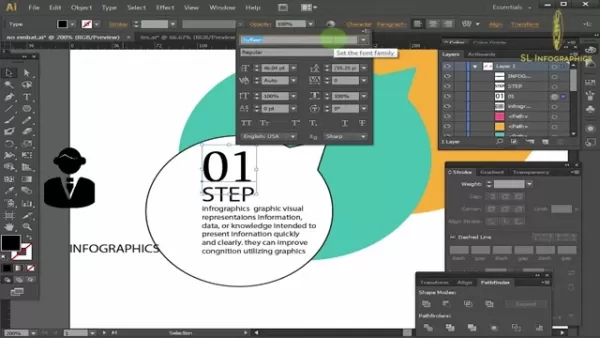
- Typography: Select readable fonts and use them consistently. Use bolding, italics, and varying sizes to highlight crucial information and ensure contrast with the background.
Advanced Techniques for Infographic Design
Creating and Using Gradients for Visual Depth
Gradients can add depth and visual interest to your infographics. Adobe Illustrator's gradient tool helps create smooth color transitions that you can apply to shape backgrounds, data visualizations, and illustrative elements. Experiment with linear, radial, and freeform gradients to achieve dynamic visuals:
- Open the 'Gradient' panel to modify or create new gradients.
- Adjust color stops on the slider to customize the gradient's appearance.
- For radial gradients, use the gradient tool to drag and adjust the direction on an ellipse.
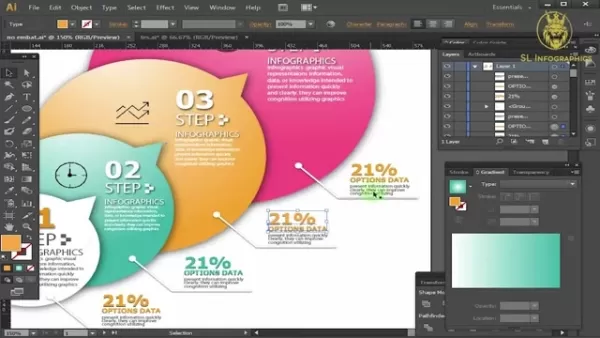
Utilizing Icons and Illustrations for Visual Communication
Icons and illustrations simplify complex information and enhance your infographic's visual appeal. They can represent abstract concepts, highlight data points, or create visual metaphors. You can create icons using shape tools, pre-made icons, or the Pen Tool.
Exporting Infographics for Optimal Online Sharing
Once your infographic is complete, exporting it in the right format is crucial for effective sharing and distribution:
- Choose the Appropriate File Format: JPEG for complex gradients and colors, PNG for transparency and sharp lines, and PDF for print and web viewing.
- Optimize for Web: Use RGB color mode for digital viewing and maintain the aspect ratio for social media.
- Exporting: Go to File > Export, and select your preferred format in the 'Save as type' field.
Creating An Infographic
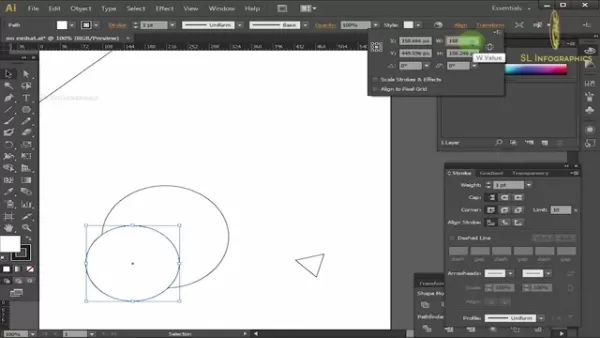
Basic Shape Tools
Understanding basic shape tools is essential for beginners to create the foundational structure of an infographic:
- Ellipse Tool: Creates circular and elliptical shapes, ideal for charts and diagrams.
- Polygon Tool: Generates polygons with a specified number of sides for unique visual accents.
- Pen Tool: Allows for the creation of precise and custom shapes by defining anchor points and paths.
Transform Tools
Transform tools are crucial for adjusting and reshaping elements within your infographic:
- Position Tools: Change coordinates to accurately place shapes and objects.
- Scale Strokes and Effects: Ensure that vector objects maintain their proportions when resized.
Adobe Illustrator Pricing Options
Choosing the Right Plan for Your Needs
Adobe Illustrator is available through Adobe Creative Cloud's subscription model. Here are the main pricing options:
- Individual Plan: Best for solo users, includes Adobe Illustrator, 100GB of cloud storage, and additional Adobe services.
- Business Plan: Designed for teams, includes everything in the Individual plan plus advanced collaboration and support features.
- Student and Teacher Plan: Discounted for eligible students and educators, provides access to all Creative Cloud apps.
- All Apps Plan: Access to all Adobe Creative Cloud applications, ideal for users needing a wide range of tools.
The Pros and Cons of Choosing Adobe Illustrator for Infographics
Pros
- High-Quality Vector Graphics: Creates scalable and crisp visuals.
- Comprehensive Design Tools: Offers a wide range of tools for custom designs.
- Typography Control: Provides precise control over text.
- Seamless Integration: Works well with other Adobe Creative Cloud apps.
- Professional Standards: Widely used and accepted in the design industry.
Cons
- Subscription-Based: Requires an ongoing subscription, which can be costly.
- Steep Learning Curve: Complex interface can be challenging for beginners.
- Resource-Intensive: May require a powerful computer to run smoothly.
- Not Ideal for Image-Heavy Infographics: Other software like Adobe Photoshop may be better for complex image manipulation.
Core Features for Great Infographics
Benefits of Creating an Infographic with Adobe Illustrator
Using Adobe Illustrator to create infographics offers several advantages:
- Information is quicker to read and absorb.
- More effective than text alone.
- Adds value to presentations.
- Enhances cognitive processing for the end user.
Illustrator Features
Here are some core features of Adobe Illustrator that make it ideal for infographic design:
- Vector Graphics Editing: Allows for scalable, resolution-independent graphics.
- Shape and Path Tools: Provides tools for creating precise and custom shapes.
- Typography Control: Fine-tunes visual hierarchy with precise typography control.
- Color Management: Ensures color consistency across different devices and media.
- Export Options: Offers diverse export options for web or print distribution.
Real-World Use Cases for Adobe Illustrator Infographics
Infographics created with Adobe Illustrator can be used in various scenarios:
- Share data-driven information in client presentations.
- Compare data points for customers.
- Enhance internal memos to better instruct and inform employees.
Related Questions about Infographics
What Other Skills Should I Possess to Make Effective Infographics?
Beyond technical proficiency in Adobe Illustrator, several skills can enhance your infographic design:
- Data Visualization: Learn to represent data visually with various chart types like bar charts, pie charts, line graphs, and scatter plots.
- Graphic Design Principles: Understand and apply good design principles to create visually appealing infographics.
- Copywriting and Storytelling: Develop skills in crafting concise, compelling copy and creating a narrative flow to engage viewers.
Related article
 Eminememerald's Houdini AI Cover: A Unique Blocky Rendition of a Classic
Get ready to dive into a musical experience that's truly one-of-a-kind! Eminememerald has just released an AI-generated cover of Eminem's latest track, "Houdini," and it's making waves across the internet. This isn't your typical cover; it's a brilliant fusion of Eminem's iconic rap style with a pla
AI Document Summarization Enhances Productivity Through Technology
Ever found yourself bogged down by endless legal documents, confusing medical bills, or intricate insurance policies? In our fast-paced world, time is a precious commodity, and wading through dense jargon can feel like a never-ending chore. Thankfully, Artificial Intelligence (AI) comes to the rescu
Stable Fast 3D: Transforming the 3D Modeling Industry
In the ever-changing world of 3D modeling, innovations are popping up left and right. One particularly exciting advancement is Stable Fast 3D, a revolutionary technique that transforms single 2D images into full 3D models. This approach has the potential to shake up the industry, offering a quicker,
Comments (0)
0/200
Eminememerald's Houdini AI Cover: A Unique Blocky Rendition of a Classic
Get ready to dive into a musical experience that's truly one-of-a-kind! Eminememerald has just released an AI-generated cover of Eminem's latest track, "Houdini," and it's making waves across the internet. This isn't your typical cover; it's a brilliant fusion of Eminem's iconic rap style with a pla
AI Document Summarization Enhances Productivity Through Technology
Ever found yourself bogged down by endless legal documents, confusing medical bills, or intricate insurance policies? In our fast-paced world, time is a precious commodity, and wading through dense jargon can feel like a never-ending chore. Thankfully, Artificial Intelligence (AI) comes to the rescu
Stable Fast 3D: Transforming the 3D Modeling Industry
In the ever-changing world of 3D modeling, innovations are popping up left and right. One particularly exciting advancement is Stable Fast 3D, a revolutionary technique that transforms single 2D images into full 3D models. This approach has the potential to shake up the industry, offering a quicker,
Comments (0)
0/200
May 2, 2025
RobertLewis
2
In today's fast-paced digital world, infographics have become an essential tool for breaking down complex information into visually engaging, easy-to-understand formats. Adobe Illustrator, with its powerful vector graphics capabilities, is a top choice for designers looking to craft stunning infographics. This guide will take you through the journey of creating an impactful infographic, highlighting practical techniques and design principles in Adobe Illustrator.
Key Points for Crafting Effective Infographics
Creating an infographic that resonates with your audience involves more than just throwing data onto a page. Here are some essential tips to keep in mind:
- Know Your Audience: Tailor your design to meet the interests and needs of your specific audience.
- Set a Clear Objective: Define what message or story you want your infographic to convey.
- Organize Your Data: Gather and structure your data in a way that supports your narrative.
- Choose the Right Visuals: Select visualizations that accurately represent your data and enhance understanding.
- Design a Cohesive Layout: Arrange your elements to guide the reader through the information smoothly.
- Maintain Consistency: Ensure a uniform design style throughout your infographic to keep it professional.
- Use Color Wisely: Employ colors to highlight important points and add visual interest.
- Focus on Readability: Choose fonts and sizes that are easy to read and enhance the overall design.
- Optimize for Sharing: Make sure your infographic is ready for various platforms and easy to share.
- Cite Your Sources: Always give credit to your data sources to maintain credibility.
Getting Started with Infographic Design in Adobe Illustrator
Setting Up Your Adobe Illustrator Document for Infographics
Before you dive into the creative process, setting up your Adobe Illustrator document correctly is crucial. This step ensures your infographic is formatted properly for its intended use and maintains high visual quality. Here's how to get started:
- Create a New Document: Launch Adobe Illustrator, go to File > New, and set up your infographic's parameters in the 'New Document' window.
- Select the Right Profile: Choose the 'Web' profile for infographics intended for online viewing, which sets the color mode to RGB. For print, select the 'Print' profile, which uses CMYK.
- Define the Artboard Size: Pick a size that suits your content and viewing platform. Common sizes include Letter (8.5 x 11 inches), Legal (8.5 x 14 inches), or custom sizes based on your needs.
- Understand Color Mode: Use RGB for digital displays and CMYK for print to ensure color accuracy.
- Adjust Units: Set your units of measurement (inches, pixels, etc.) for consistency and ease of use.
- Save Your Project: Early on, save your document by navigating to File > Save As, naming your file, and choosing Adobe Illustrator (*.AI) format to keep all elements editable.
Basic Shapes & Tools in Adobe Illustrator for Infographics
Adobe Illustrator provides a range of tools perfect for creating the visual elements of your infographic. Mastering these tools is key to producing engaging and informative visuals:
- Rectangle Tool: Ideal for creating borders, backgrounds, and simple visual elements.
- Ellipse Tool: Useful for charts, diagrams, and other circular or elliptical representations.
- Polygon Tool: Creates unique shapes with a specified number of sides for visual accents.
- Line Segment Tool: Draws straight lines, essential for timelines, connectors, and dividers.
- Pen Tool: Enables the creation of precise custom shapes by defining anchor points and paths.
- Rotate Tool: Allows you to rotate elements to the desired angle.
Key Design Elements: Shapes, Lines, and Typography
When designing an infographic, consider these essential design elements to ensure clarity and visual appeal:
- Shapes: Use shapes to represent data, create visual containers, and add structure to your layout. Different shapes can highlight various sections and key information.
- Lines: Employ lines to connect elements, guide the viewer's eye, and emphasize relationships. Vary line thickness and style to denote importance or connection.
- Typography: Select readable fonts and use them consistently. Use bolding, italics, and varying sizes to highlight crucial information and ensure contrast with the background.
Advanced Techniques for Infographic Design
Creating and Using Gradients for Visual Depth
Gradients can add depth and visual interest to your infographics. Adobe Illustrator's gradient tool helps create smooth color transitions that you can apply to shape backgrounds, data visualizations, and illustrative elements. Experiment with linear, radial, and freeform gradients to achieve dynamic visuals:
- Open the 'Gradient' panel to modify or create new gradients.
- Adjust color stops on the slider to customize the gradient's appearance.
- For radial gradients, use the gradient tool to drag and adjust the direction on an ellipse.
Utilizing Icons and Illustrations for Visual Communication
Icons and illustrations simplify complex information and enhance your infographic's visual appeal. They can represent abstract concepts, highlight data points, or create visual metaphors. You can create icons using shape tools, pre-made icons, or the Pen Tool.
Exporting Infographics for Optimal Online Sharing
Once your infographic is complete, exporting it in the right format is crucial for effective sharing and distribution:
- Choose the Appropriate File Format: JPEG for complex gradients and colors, PNG for transparency and sharp lines, and PDF for print and web viewing.
- Optimize for Web: Use RGB color mode for digital viewing and maintain the aspect ratio for social media.
- Exporting: Go to File > Export, and select your preferred format in the 'Save as type' field.
Creating An Infographic
Basic Shape Tools
Understanding basic shape tools is essential for beginners to create the foundational structure of an infographic:
- Ellipse Tool: Creates circular and elliptical shapes, ideal for charts and diagrams.
- Polygon Tool: Generates polygons with a specified number of sides for unique visual accents.
- Pen Tool: Allows for the creation of precise and custom shapes by defining anchor points and paths.
Transform Tools
Transform tools are crucial for adjusting and reshaping elements within your infographic:
- Position Tools: Change coordinates to accurately place shapes and objects.
- Scale Strokes and Effects: Ensure that vector objects maintain their proportions when resized.
Adobe Illustrator Pricing Options
Choosing the Right Plan for Your Needs
Adobe Illustrator is available through Adobe Creative Cloud's subscription model. Here are the main pricing options:
- Individual Plan: Best for solo users, includes Adobe Illustrator, 100GB of cloud storage, and additional Adobe services.
- Business Plan: Designed for teams, includes everything in the Individual plan plus advanced collaboration and support features.
- Student and Teacher Plan: Discounted for eligible students and educators, provides access to all Creative Cloud apps.
- All Apps Plan: Access to all Adobe Creative Cloud applications, ideal for users needing a wide range of tools.
The Pros and Cons of Choosing Adobe Illustrator for Infographics
Pros
- High-Quality Vector Graphics: Creates scalable and crisp visuals.
- Comprehensive Design Tools: Offers a wide range of tools for custom designs.
- Typography Control: Provides precise control over text.
- Seamless Integration: Works well with other Adobe Creative Cloud apps.
- Professional Standards: Widely used and accepted in the design industry.
Cons
- Subscription-Based: Requires an ongoing subscription, which can be costly.
- Steep Learning Curve: Complex interface can be challenging for beginners.
- Resource-Intensive: May require a powerful computer to run smoothly.
- Not Ideal for Image-Heavy Infographics: Other software like Adobe Photoshop may be better for complex image manipulation.
Core Features for Great Infographics
Benefits of Creating an Infographic with Adobe Illustrator
Using Adobe Illustrator to create infographics offers several advantages:
- Information is quicker to read and absorb.
- More effective than text alone.
- Adds value to presentations.
- Enhances cognitive processing for the end user.
Illustrator Features
Here are some core features of Adobe Illustrator that make it ideal for infographic design:
- Vector Graphics Editing: Allows for scalable, resolution-independent graphics.
- Shape and Path Tools: Provides tools for creating precise and custom shapes.
- Typography Control: Fine-tunes visual hierarchy with precise typography control.
- Color Management: Ensures color consistency across different devices and media.
- Export Options: Offers diverse export options for web or print distribution.
Real-World Use Cases for Adobe Illustrator Infographics
Infographics created with Adobe Illustrator can be used in various scenarios:
- Share data-driven information in client presentations.
- Compare data points for customers.
- Enhance internal memos to better instruct and inform employees.
Related Questions about Infographics
What Other Skills Should I Possess to Make Effective Infographics?
Beyond technical proficiency in Adobe Illustrator, several skills can enhance your infographic design:
- Data Visualization: Learn to represent data visually with various chart types like bar charts, pie charts, line graphs, and scatter plots.
- Graphic Design Principles: Understand and apply good design principles to create visually appealing infographics.
- Copywriting and Storytelling: Develop skills in crafting concise, compelling copy and creating a narrative flow to engage viewers.


 Eminememerald's Houdini AI Cover: A Unique Blocky Rendition of a Classic
Get ready to dive into a musical experience that's truly one-of-a-kind! Eminememerald has just released an AI-generated cover of Eminem's latest track, "Houdini," and it's making waves across the internet. This isn't your typical cover; it's a brilliant fusion of Eminem's iconic rap style with a pla
Eminememerald's Houdini AI Cover: A Unique Blocky Rendition of a Classic
Get ready to dive into a musical experience that's truly one-of-a-kind! Eminememerald has just released an AI-generated cover of Eminem's latest track, "Houdini," and it's making waves across the internet. This isn't your typical cover; it's a brilliant fusion of Eminem's iconic rap style with a pla
 AI Document Summarization Enhances Productivity Through Technology
Ever found yourself bogged down by endless legal documents, confusing medical bills, or intricate insurance policies? In our fast-paced world, time is a precious commodity, and wading through dense jargon can feel like a never-ending chore. Thankfully, Artificial Intelligence (AI) comes to the rescu
AI Document Summarization Enhances Productivity Through Technology
Ever found yourself bogged down by endless legal documents, confusing medical bills, or intricate insurance policies? In our fast-paced world, time is a precious commodity, and wading through dense jargon can feel like a never-ending chore. Thankfully, Artificial Intelligence (AI) comes to the rescu
 Stable Fast 3D: Transforming the 3D Modeling Industry
In the ever-changing world of 3D modeling, innovations are popping up left and right. One particularly exciting advancement is Stable Fast 3D, a revolutionary technique that transforms single 2D images into full 3D models. This approach has the potential to shake up the industry, offering a quicker,
Stable Fast 3D: Transforming the 3D Modeling Industry
In the ever-changing world of 3D modeling, innovations are popping up left and right. One particularly exciting advancement is Stable Fast 3D, a revolutionary technique that transforms single 2D images into full 3D models. This approach has the potential to shake up the industry, offering a quicker,