AI-Driven Development of New Open Buildings Dataset Unveiled
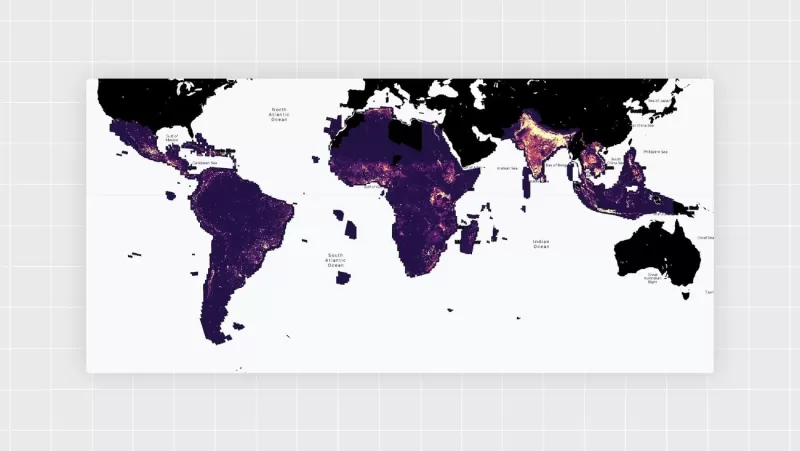
In 2021, the Google Research Africa team kicked off Open Buildings, an open-source dataset that maps building footprints across the Global South using AI and high-resolution satellite imagery. Their goal was pretty straightforward: to plug a big hole in the data about population and density in developing countries. Now, with the third version out, their dataset boasts polygons for a whopping 1.8 billion buildings spread over 58 million km² in Africa, South and Southeast Asia, Latin America, and the Caribbean.
A bunch of folks, from governments to the UN, and even researchers and nonprofits, have been using Open Buildings to get a handle on population size and distribution. This has helped them plan better for things like vaccination drives and disaster response. Plus, it's even beefed up Google Maps by adding millions of buildings that weren't mapped before.
The team, based in Ghana but with members scattered across places like Tel Aviv and Zurich, has been on a mission to make the project even more useful. "We're always in hackathon mode, trying out new ideas and tackling challenges," says Google Research program manager Abdoulaye Diack. "One thing we couldn't do with the original dataset was show how areas change over time—it was static. And that's something our partners really wanted."
Commercial satellite image providers usually focus on areas that bring in the bucks, leaving about 40% of the world, mostly the Global South, without regular high-res coverage. Some remote spots and informal settlements don't get any coverage at all. Meanwhile, open-source imagery from the European Space Agency's Sentinel-2 satellite, which snaps a global pic every five days, was thought to be too low-res for building detection.
But the team figured it might not be as big a deal as they thought, so they gave it a shot.
First, they fed a single low-res frame from Sentinel-2 into their model and asked it to draw building polygons. "It was tough, but we saw potential," Abdoulaye says. "So we told the model to just give us the building masks—binary pixel data tied to specific spots. It did okay, and we thought, 'Hey, we can do this.'"
After a year of tweaking the model, they rolled out the Open Buildings 2.5D Temporal Dataset last month. It covers 2016 to 2023 and gives an annual snapshot of building presence and counts across much of the Global South, plus building heights. This shows how cities change due to development, disasters, and other factors. Users can pick a region, flip through the years, and watch the world grow and shrink in a colorful display of shapes.
"By 2050, about 2.5 billion more people might move to cities, mostly in the Global South. This dataset could be a game-changer for governments and organizations dealing with that growth," says Google Research product manager Olivia Graham. "If a city's planning where to put essential services like healthcare and education, or where to build infrastructure like water and energy supplies, this dataset shows which areas are growing fast."
On September 28, 2018, a massive 7.4 magnitude earthquake off Indonesia's coast triggered a tsunami, impacting around 1.5 million people on Sulawesi. The dataset shows how the built area pulled back from the coast after the disaster. You can check it out in our interactive Earth Engine app.
You can also see the construction of New Cairo, Egypt, in the Open Buildings 2.5D Temporal Dataset demo.
So, how did the team manage to get their model to read Sentinel-2's fuzzy satellite images and confidently detect buildings? They started by sharpening things up.
"We used a teacher-student model setup to both 'super-resolve' the low-res images and pull out the building footprints," says Google Research software engineer Krishna Sapkota. "The teacher model learns to spot buildings in high-res images and gives labels to the student model. The student model, which actually creates the dataset, learns from the teacher's output. It can then take low-res images from Sentinel-2 and guess what a higher-res version would look like."
The teacher model gives high-res training labels to the student model, which then figures out building presence from low-res imagery.
To get the detail needed for building footprints, the model uses up to 32 frames of Sentinel-2 images of a spot for any prediction. Each frame is a bit different from the others, thanks to the tiny time gap between captures, which helps boost resolution—kind of like how Pixel phones use multiple shots for sharper images.
Unlike the original dataset, which gave precise polygonal outlines of buildings, the new temporal dataset uses raster data for building footprints. It also predicts building heights, crucial for estimating population density, with an error of just 1.5 meters, or less than one story.
Before its official release, the temporal dataset was shared with trusted partners like Ugandan nonprofit Sunbird AI. "About 73% of Ugandans don't have electricity, and Sunbird AI used our original database to help the government figure out where to put microgrids or solar panels," Olivia says. "With the new dataset, they're looking at Jinja and Fort Portal, creating visuals that help city councils see where growth is happening fast and adjust their plans. It shows how both datasets can be part of a bigger toolkit to understand a population and how it's changing."
The same curiosity that led to the temporal dataset is pushing the team to keep improving it.
"I live in Ghana and see the impact our work is having and can have," Abdoulaye says. "Many places here struggle with resources, which leads to data gaps with big consequences. Being part of a team working to fix that and make a difference is a real honor."
Related article
 Midjourney Unveils Cutting-Edge AI Video Generator for Creative Content
Midjourney's AI Video Generation BreakthroughMidjourney has unveiled its inaugural AI video generation tool, marking a significant expansion beyond its renowned image creation capabilities. The initial release enables users to transform both uploaded
Trump Prioritizes AI Growth Over Regulation in Race to Outpace China
The Trump administration unveiled its landmark AI Action Plan on Wednesday, marking a decisive break from the Biden administration's risk-averse AI policies. The ambitious blueprint prioritizes aggressive infrastructure development, sweeping regulato
YouTube Integrates Veo 3 AI Video Tool Directly Into Shorts Platform
YouTube Shorts to Feature Veo 3 AI Video Model This SummerYouTube CEO Neal Mohan revealed during his Cannes Lions keynote that the platform's cutting-edge Veo 3 AI video generation technology will debut on YouTube Shorts later this summer. This follo
Comments (28)
0/200
Midjourney Unveils Cutting-Edge AI Video Generator for Creative Content
Midjourney's AI Video Generation BreakthroughMidjourney has unveiled its inaugural AI video generation tool, marking a significant expansion beyond its renowned image creation capabilities. The initial release enables users to transform both uploaded
Trump Prioritizes AI Growth Over Regulation in Race to Outpace China
The Trump administration unveiled its landmark AI Action Plan on Wednesday, marking a decisive break from the Biden administration's risk-averse AI policies. The ambitious blueprint prioritizes aggressive infrastructure development, sweeping regulato
YouTube Integrates Veo 3 AI Video Tool Directly Into Shorts Platform
YouTube Shorts to Feature Veo 3 AI Video Model This SummerYouTube CEO Neal Mohan revealed during his Cannes Lions keynote that the platform's cutting-edge Veo 3 AI video generation technology will debut on YouTube Shorts later this summer. This follo
Comments (28)
0/200
![WillieJohnson]() WillieJohnson
WillieJohnson
 August 21, 2025 at 5:01:34 PM EDT
This dataset sounds like a game-changer for urban planning! Mapping buildings in the Global South with AI is super cool, but I wonder how accurate it is in super dense areas. 🏙️


 0
0
![JustinHarris]() JustinHarris
July 30, 2025 at 9:41:20 PM EDT
JustinHarris
July 30, 2025 at 9:41:20 PM EDT
Super cool to see AI mapping buildings in the Global South! 😮 Makes me wonder how this could help urban planning or disaster response.
0
![KennethJohnson]() KennethJohnson
July 22, 2025 at 2:33:07 AM EDT
KennethJohnson
July 22, 2025 at 2:33:07 AM EDT
This dataset sounds like a game-changer for urban planning! 😮 I wonder how accurate those AI-mapped footprints are compared to real-world buildings.
0
![CarlHill]() CarlHill
April 18, 2025 at 3:10:36 PM EDT
CarlHill
April 18, 2025 at 3:10:36 PM EDT
新しいオープンビルディングデータセットのAI駆動開発はすごくクール!AIと衛星画像でグローバルサウスの建物のフットプリントをマッピングできるなんて驚きだ。でも、データが少し圧倒的すぎる。とはいえ、人口密度を理解するのに素晴らしいツールだよ!🌍📊
0
![LarryMartin]() LarryMartin
April 17, 2025 at 12:08:18 PM EDT
LarryMartin
April 17, 2025 at 12:08:18 PM EDT
새로운 오픈 빌딩 데이터셋의 AI 기반 개발은 정말 멋져요! AI와 위성 이미지를 통해 글로벌 사우스의 건물 발자국을 매핑할 수 있다는 게 놀랍네요. 하지만 데이터가 조금 압도적이에요. 그래도 인구 밀도를 이해하는 데 좋은 도구예요! 🌍📊
0
![StevenGreen]() StevenGreen
April 16, 2025 at 12:37:39 AM EDT
StevenGreen
April 16, 2025 at 12:37:39 AM EDT
El Desarrollo Impulsado por IA del Nuevo Conjunto de Datos de Edificios Abiertos es súper genial. Es increíble cómo la IA y las imágenes satelitales pueden mapear las huellas de los edificios en el Sur Global. Pero, los datos pueden ser un poco abrumadores. Aún así, es una gran herramienta para entender la densidad de población. 🌍📊
0


 Midjourney Unveils Cutting-Edge AI Video Generator for Creative Content
Midjourney's AI Video Generation BreakthroughMidjourney has unveiled its inaugural AI video generation tool, marking a significant expansion beyond its renowned image creation capabilities. The initial release enables users to transform both uploaded
Midjourney Unveils Cutting-Edge AI Video Generator for Creative Content
Midjourney's AI Video Generation BreakthroughMidjourney has unveiled its inaugural AI video generation tool, marking a significant expansion beyond its renowned image creation capabilities. The initial release enables users to transform both uploaded
 Trump Prioritizes AI Growth Over Regulation in Race to Outpace China
The Trump administration unveiled its landmark AI Action Plan on Wednesday, marking a decisive break from the Biden administration's risk-averse AI policies. The ambitious blueprint prioritizes aggressive infrastructure development, sweeping regulato
Trump Prioritizes AI Growth Over Regulation in Race to Outpace China
The Trump administration unveiled its landmark AI Action Plan on Wednesday, marking a decisive break from the Biden administration's risk-averse AI policies. The ambitious blueprint prioritizes aggressive infrastructure development, sweeping regulato
 YouTube Integrates Veo 3 AI Video Tool Directly Into Shorts Platform
YouTube Shorts to Feature Veo 3 AI Video Model This SummerYouTube CEO Neal Mohan revealed during his Cannes Lions keynote that the platform's cutting-edge Veo 3 AI video generation technology will debut on YouTube Shorts later this summer. This follo
August 21, 2025 at 5:01:34 PM EDT
YouTube Integrates Veo 3 AI Video Tool Directly Into Shorts Platform
YouTube Shorts to Feature Veo 3 AI Video Model This SummerYouTube CEO Neal Mohan revealed during his Cannes Lions keynote that the platform's cutting-edge Veo 3 AI video generation technology will debut on YouTube Shorts later this summer. This follo
August 21, 2025 at 5:01:34 PM EDT
This dataset sounds like a game-changer for urban planning! Mapping buildings in the Global South with AI is super cool, but I wonder how accurate it is in super dense areas. 🏙️
0
July 30, 2025 at 9:41:20 PM EDT
Super cool to see AI mapping buildings in the Global South! 😮 Makes me wonder how this could help urban planning or disaster response.
0
July 22, 2025 at 2:33:07 AM EDT
This dataset sounds like a game-changer for urban planning! 😮 I wonder how accurate those AI-mapped footprints are compared to real-world buildings.
0
April 18, 2025 at 3:10:36 PM EDT
新しいオープンビルディングデータセットのAI駆動開発はすごくクール!AIと衛星画像でグローバルサウスの建物のフットプリントをマッピングできるなんて驚きだ。でも、データが少し圧倒的すぎる。とはいえ、人口密度を理解するのに素晴らしいツールだよ!🌍📊
0
April 17, 2025 at 12:08:18 PM EDT
새로운 오픈 빌딩 데이터셋의 AI 기반 개발은 정말 멋져요! AI와 위성 이미지를 통해 글로벌 사우스의 건물 발자국을 매핑할 수 있다는 게 놀랍네요. 하지만 데이터가 조금 압도적이에요. 그래도 인구 밀도를 이해하는 데 좋은 도구예요! 🌍📊
0
April 16, 2025 at 12:37:39 AM EDT
El Desarrollo Impulsado por IA del Nuevo Conjunto de Datos de Edificios Abiertos es súper genial. Es increíble cómo la IA y las imágenes satelitales pueden mapear las huellas de los edificios en el Sur Global. Pero, los datos pueden ser un poco abrumadores. Aún así, es una gran herramienta para entender la densidad de población. 🌍📊
0