Home
HomeUnveiling the Turing 1950: A Guide to the AI Infographic Video Generator
In today's fast-paced digital landscape, compelling and informative content is essential for effective communication. Infographic videos are a powerful medium for presenting data and complex information in an easily digestible format. Turing 1950 is an innovative, AI-powered tool that streamlines and automates the creation of engaging infographic videos from text or CSV data. This article provides a demonstration of Turing 1950, examining its features, capabilities, and potential applications.
Key Points
Turing 1950 uses artificial intelligence to produce infographic videos.
Data can be entered via text queries or by uploading CSV files.
The platform provides different video templates, such as Modern and Gradient.
AI technology refines text and automatically creates video frames.
The tool builds charts and data visualizations from provided information.
While still under development, it shows significant promise.
Turing 1950: An AI-Powered Infographic Video Generator
What is Turing 1950?
Turing 1950 is a state-of-the-art AI platform dedicated to effortless infographic video production.
It enables users to create visually appealing and informative videos from straightforward text inputs or structured data in CSV files. The objective is to democratize video creation, making it accessible to individuals and businesses without advanced design or video editing expertise. Turing 1950 was conceived to address the specific challenge faced by AOS Lab: generating infographic videos with ease, even under tight deadlines. Powered by sophisticated AI algorithms, Turing 1950 automates the entire video creation workflow, from content comprehension to final visualization and rendering. It is a transformative tool for content creators, marketers, educators, and anyone needing to communicate intricate information more effectively.
Core features include:
- Text-to-video generation: Transform written content into dynamic video formats.
- CSV data visualization: Convert spreadsheet data into insightful charts and graphs within videos.
- Automated frame creation: AI-driven generation of video frames and scene transitions.
- Customizable templates: A selection of pre-designed video templates to choose from.
The Infographic Video Generator helps overcome the difficulty of rapidly updating visualizations with new data, empowering content creators, video editors, designers, data analysts, and their audiences to access fresh content swiftly. It provides a system that accepts text input with data or statistics, automatically identifies the data type, selects suitable visualization techniques, dynamically generates animated infographics, and exports them as production-ready video files.
The Turing 1950 Demo: A Step-by-Step Walkthrough
The demonstration video thoroughly showcases Turing 1950's functionalities. Here is the detailed process:
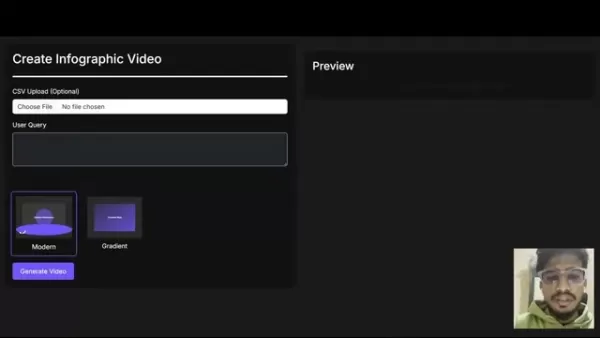
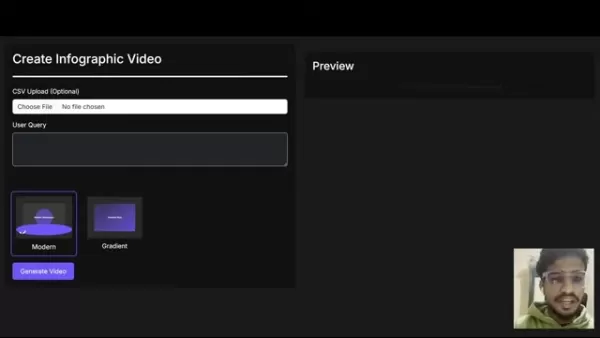
Accessing the Dashboard: The presenter starts by explaining the straightforward MVP dashboard of Turing 1950.
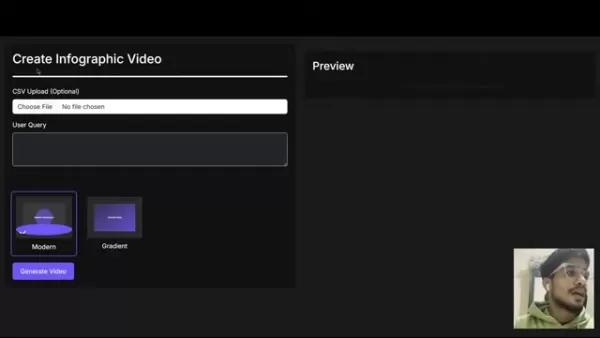
Data Input Options: Users can input their data in two primary ways:
- CSV Upload: Upload a CSV file with structured data. This is ideal for more complex datasets.
- User Query: Type a text query directly into the system. This method works well for simpler data points or statements.
Template Selection: Currently, Turing 1950 features two distinct video styles: Modern and Gradient. Users can pick the template that aligns best with their intended visual presentation.
Generating the Video: After providing the data and choosing a template, the user clicks the Generate Video button. The AI then processes the information, improves the text, and creates frames and transitions.
Preview and Download: Once generation is complete, a preview of the video is displayed. The user can then download the final video in MP4 format.
Example 1: Text-Based Input
The presenter first shows how text-based input works. A sample problem statement from AOS Lab is copied:
"20% of users own an iPhone, 50% own a Samsung, and the rest own a variety of brands."
This text query is pasted into the dashboard. The Modern template is selected, and the Generate Video button is clicked. The system intelligently analyzes the data and produces a visually clear pie chart showing the smartphone ownership distribution.
Example 2: CSV File Input
To demonstrate CSV file input, a "Spotify Most Streamed Songs" dataset from Kaggle is used. The file is uploaded to the platform. The user then enters the query “top release in 2023”. After the video is generated, it displays various charts automatically created by the system from the CSV data, specifically tailored to the “top release” prompt. These include a bar graph and animated metrics.
The following table provides a summary of the workflow:
Step Description 1. Accessing Dashboard An introduction to the Turing 1950 dashboard interface. 2. Data Input Option to input text data or upload a CSV file. 3. Template Selection Choice between the Modern or Gradient template to define the video's look and feel. 4. Generate Video The AI processes the input data and selected template to create the video. 5. Preview and Download Review the generated video and download it as an MP4 file.
Disclaimers and Future Potential
Important Considerations
The presenter stressed that Turing 1950 is currently in the early phases of its development.
The team had only started developing the project within the 24 hours preceding the demonstration, indicating it is a Minimum Viable Product (MVP). A clear understanding of the central problem and the desired outcome only emerged after discussions with AOS Lab. Consequently, the platform's quality, accuracy, and feature set are expected to improve substantially over time. This demonstration is intended to highlight the fundamental potential of an AI-driven infographic video generator.
The presenter notes, "Our perspective on this issue evolved. It was only after our initial call with AOS Lab that we truly grasped the core of the problem."
Key Metrics Displayed on the Output
The infographic videos produced by Turing 1950 showcase a variety of metrics and statistics.

These key performance indicators include:
- Pie Charts: For example, showing 20% iPhone ownership, 50% Samsung, and 30% other devices.
- Animations for 2023 Top Releases and other music statistics.
- Visualizations tracking performance over different time periods.
This data is dynamically presented through automatically generated animated infographic videos.
Pros and Cons
Pros
Streamlines the process of creating infographic videos.
Automates the generation of frames and scene transitions.
Provides a selection of different templates.
Uses AI to polish text and produce captivating videos.
Enables quick updates to visualizations when new data is available.
Cons
Currently in the early stages of development.
Customization options were limited during the demonstration.
Depends on AI's interpretation of data, which may occasionally lack perfect accuracy.
Frequently Asked Questions
What type of data inputs does Turing 1950 support?
Turing 1950 accepts data through text-based queries or by uploading CSV files. This flexibility allows users to efficiently produce infographic videos from various data sources.
What templates are available?
During the demonstration, Turing 1950 offered two main video templates: Modern and Gradient. The development team is working on introducing more options.
Is this AI infographic video generator easy to use?
A primary objective of Turing 1950 is to make video creation accessible to all. The platform's user-friendly dashboard and automated AI operations significantly simplify the entire workflow.
Are the output videos customizable?
Yes, you can customize the final videos by selecting the template that best presents your data. The team is actively developing further customization features.
Related Questions
What are the benefits of infographic videos?
Infographic videos are highly engaging and excellent for conveying data, concepts, and complex information. They can be easily distributed across social media platforms, leading to greater brand visibility and improved conversion rates. Viewers retain approximately 95% of a message from a video, compared to only about 10% when reading text.
How can AI tools be used in marketing?
AI has the potential to transform marketing by enhancing customer experiences through personalization, increasing marketing ROI via customer insight analysis, and automating routine tasks. It can be effectively used to generate infographic videos from straightforward datasets.
Related article
 Haier Launches World's Lightest AI Sports Exoskeleton Robot, Weighing Just 1.75 kg
Haier Group has introduced the world's lightest AI-powered exoskeleton robot for sports — the Haier Exoskeleton Robot W3. This launch sets a new industry record for lightness, marking a major breakthrough in lightweight design and intelligent human m
Yaoke Media's First AIGC Drama 'The Mystery of the Bronze in Qinling' Launches Today with AI-Signed Leads
Today marks the official launch of Yaoke Media's AIGC fantasy mystery short drama, "The Secret Story of the Qinling Bronze." Starring the company's first two signed AI actors, Qin Lingyue and Lin Xiyanyan, the story unfolds in the enigmatic Qinling m
Satya Nadella ready to exploit new OpenAI deal
On Wednesday, a Wall Street analyst asked Microsoft CEO Satya Nadella directly how the revised OpenAI partnership would affect the company’s financials.Nadella described the new agreement as a win for everyone. “We feel good about our partnership wit
Related Special Topic Recommendations
Business
Haier Launches World's Lightest AI Sports Exoskeleton Robot, Weighing Just 1.75 kg
Haier Group has introduced the world's lightest AI-powered exoskeleton robot for sports — the Haier Exoskeleton Robot W3. This launch sets a new industry record for lightness, marking a major breakthrough in lightweight design and intelligent human m
Yaoke Media's First AIGC Drama 'The Mystery of the Bronze in Qinling' Launches Today with AI-Signed Leads
Today marks the official launch of Yaoke Media's AIGC fantasy mystery short drama, "The Secret Story of the Qinling Bronze." Starring the company's first two signed AI actors, Qin Lingyue and Lin Xiyanyan, the story unfolds in the enigmatic Qinling m
Satya Nadella ready to exploit new OpenAI deal
On Wednesday, a Wall Street analyst asked Microsoft CEO Satya Nadella directly how the revised OpenAI partnership would affect the company’s financials.Nadella described the new agreement as a win for everyone. “We feel good about our partnership wit
Related Special Topic Recommendations
Business
 Best AI Expense Trackers: Scan Receipts & Categorize Corporate Spend Automatically
2026 Latest Best AI Expense Trackers: Top-rated tools to scan receipts & categorize corporate spend automatically. Discover powerful, game-changing solutions for effortless expense management, accurate financial tracking, and streamlined compliance. Our curated, weekly-updated comparison of free vs paid options helps you find the perfect fit. Unlock your AI edge with XIX.AI's expert picks.
 10 tools
 xix.ai
Business
Best AI Recruiting Tools: Screen Resumes & Automate Candidate Interview Scheduling
xix.ai
Business
Best AI Recruiting Tools: Screen Resumes & Automate Candidate Interview Scheduling
Discover the 2026 latest top-rated AI recruiting tools on XIX.AI. Our curated list features powerful, game-changing solutions for screening resumes and automating candidate interview scheduling. Compare free vs paid options with real-world tests and weekly updated rankings. Find your perfect hiring assistant and streamline your recruitment today!
10 tools
xix.ai
Productivity
AI Personal Wellness & Focus Coaches: Manage Burnout & Boost Mental Energy Levels
Discover the 2026 best AI personal wellness and focus coaches on XIX.AI. Our curated rankings feature top-rated, game-changing tools to manage burnout and boost mental energy. Compare free vs paid options with real-world insights. Unlock your path to peak productivity and well-being today.
10 tools
xix.ai
chatbot
Top-Rated AI Romantic Chatbots: Build Long-Term Relationships with Consistent Personalities
Discover the 2026 latest top-rated AI romantic chatbots for building genuine, long-term connections. Our curated list features powerful, consistent personalities, free vs paid comparisons, and real-world tests. Find your perfect companion and start building today at XIX.AI.
10 tools
xix.ai
Education and Learning
Best AI Data Science Mentors: Master SQL, Pandas & Machine Learning Workflows
Discover the 2026 best AI data science mentors to master SQL, Pandas & ML workflows. Explore our top-rated, curated selection at XIX.AI for powerful, game-changing guidance. Compare free vs paid options with real-world insights. Unlock your data science mastery today.
10 tools
xix.ai
chatbot
Best AI Flirting & Conversation Trainers: Improve Social Charisma and Confidence in Real-Time
Discover the 2026 best AI flirting and conversation trainers on XIX.AI. Our curated, top-rated selection helps you build social charisma and confidence in real-time. Explore must-try, game-changing tools with free vs paid comparisons and weekly updated rankings. Unlock your social edge today.
10 tools
xix.ai

 Comments (1)
0/500
Comments (1)
0/500
![KennethMartin]()
Не уверен, что это так уж революционно... Инфографика и так повсюду, а тут ещё и ИИ подключают. Интересно, насколько качественным будет результат? Или это очередная попытка автоматизировать творческий процесс, который требует человеческого подхода? 🤔
In today's fast-paced digital landscape, compelling and informative content is essential for effective communication. Infographic videos are a powerful medium for presenting data and complex information in an easily digestible format. Turing 1950 is an innovative, AI-powered tool that streamlines and automates the creation of engaging infographic videos from text or CSV data. This article provides a demonstration of Turing 1950, examining its features, capabilities, and potential applications.
Key Points
Turing 1950 uses artificial intelligence to produce infographic videos.
Data can be entered via text queries or by uploading CSV files.
The platform provides different video templates, such as Modern and Gradient.
AI technology refines text and automatically creates video frames.
The tool builds charts and data visualizations from provided information.
While still under development, it shows significant promise.
Turing 1950: An AI-Powered Infographic Video Generator
What is Turing 1950?
Turing 1950 is a state-of-the-art AI platform dedicated to effortless infographic video production.
It enables users to create visually appealing and informative videos from straightforward text inputs or structured data in CSV files. The objective is to democratize video creation, making it accessible to individuals and businesses without advanced design or video editing expertise. Turing 1950 was conceived to address the specific challenge faced by AOS Lab: generating infographic videos with ease, even under tight deadlines. Powered by sophisticated AI algorithms, Turing 1950 automates the entire video creation workflow, from content comprehension to final visualization and rendering. It is a transformative tool for content creators, marketers, educators, and anyone needing to communicate intricate information more effectively.
Core features include:
- Text-to-video generation: Transform written content into dynamic video formats.
- CSV data visualization: Convert spreadsheet data into insightful charts and graphs within videos.
- Automated frame creation: AI-driven generation of video frames and scene transitions.
- Customizable templates: A selection of pre-designed video templates to choose from.
The Infographic Video Generator helps overcome the difficulty of rapidly updating visualizations with new data, empowering content creators, video editors, designers, data analysts, and their audiences to access fresh content swiftly. It provides a system that accepts text input with data or statistics, automatically identifies the data type, selects suitable visualization techniques, dynamically generates animated infographics, and exports them as production-ready video files.
The Turing 1950 Demo: A Step-by-Step Walkthrough
The demonstration video thoroughly showcases Turing 1950's functionalities. Here is the detailed process:
Accessing the Dashboard: The presenter starts by explaining the straightforward MVP dashboard of Turing 1950.
Data Input Options: Users can input their data in two primary ways:
- CSV Upload: Upload a CSV file with structured data. This is ideal for more complex datasets.
- User Query: Type a text query directly into the system. This method works well for simpler data points or statements.
Template Selection: Currently, Turing 1950 features two distinct video styles: Modern and Gradient. Users can pick the template that aligns best with their intended visual presentation.
Generating the Video: After providing the data and choosing a template, the user clicks the Generate Video button. The AI then processes the information, improves the text, and creates frames and transitions.
Preview and Download: Once generation is complete, a preview of the video is displayed. The user can then download the final video in MP4 format.
Example 1: Text-Based Input
The presenter first shows how text-based input works. A sample problem statement from AOS Lab is copied:
"20% of users own an iPhone, 50% own a Samsung, and the rest own a variety of brands."
This text query is pasted into the dashboard. The Modern template is selected, and the Generate Video button is clicked. The system intelligently analyzes the data and produces a visually clear pie chart showing the smartphone ownership distribution.
Example 2: CSV File Input
To demonstrate CSV file input, a "Spotify Most Streamed Songs" dataset from Kaggle is used. The file is uploaded to the platform. The user then enters the query “top release in 2023”. After the video is generated, it displays various charts automatically created by the system from the CSV data, specifically tailored to the “top release” prompt. These include a bar graph and animated metrics.
The following table provides a summary of the workflow:
| Step | Description |
|---|---|
| 1. Accessing Dashboard | An introduction to the Turing 1950 dashboard interface. |
| 2. Data Input | Option to input text data or upload a CSV file. |
| 3. Template Selection | Choice between the Modern or Gradient template to define the video's look and feel. |
| 4. Generate Video | The AI processes the input data and selected template to create the video. |
| 5. Preview and Download | Review the generated video and download it as an MP4 file. |
Disclaimers and Future Potential
Important Considerations
The presenter stressed that Turing 1950 is currently in the early phases of its development.
The team had only started developing the project within the 24 hours preceding the demonstration, indicating it is a Minimum Viable Product (MVP). A clear understanding of the central problem and the desired outcome only emerged after discussions with AOS Lab. Consequently, the platform's quality, accuracy, and feature set are expected to improve substantially over time. This demonstration is intended to highlight the fundamental potential of an AI-driven infographic video generator.
The presenter notes, "Our perspective on this issue evolved. It was only after our initial call with AOS Lab that we truly grasped the core of the problem."
Key Metrics Displayed on the Output
The infographic videos produced by Turing 1950 showcase a variety of metrics and statistics.
These key performance indicators include:
- Pie Charts: For example, showing 20% iPhone ownership, 50% Samsung, and 30% other devices.
- Animations for 2023 Top Releases and other music statistics.
- Visualizations tracking performance over different time periods.
This data is dynamically presented through automatically generated animated infographic videos.
Pros and Cons
Pros
Streamlines the process of creating infographic videos.
Automates the generation of frames and scene transitions.
Provides a selection of different templates.
Uses AI to polish text and produce captivating videos.
Enables quick updates to visualizations when new data is available.
Cons
Currently in the early stages of development.
Customization options were limited during the demonstration.
Depends on AI's interpretation of data, which may occasionally lack perfect accuracy.
Frequently Asked Questions
What type of data inputs does Turing 1950 support?
Turing 1950 accepts data through text-based queries or by uploading CSV files. This flexibility allows users to efficiently produce infographic videos from various data sources.
What templates are available?
During the demonstration, Turing 1950 offered two main video templates: Modern and Gradient. The development team is working on introducing more options.
Is this AI infographic video generator easy to use?
A primary objective of Turing 1950 is to make video creation accessible to all. The platform's user-friendly dashboard and automated AI operations significantly simplify the entire workflow.
Are the output videos customizable?
Yes, you can customize the final videos by selecting the template that best presents your data. The team is actively developing further customization features.
Related Questions
What are the benefits of infographic videos?
Infographic videos are highly engaging and excellent for conveying data, concepts, and complex information. They can be easily distributed across social media platforms, leading to greater brand visibility and improved conversion rates. Viewers retain approximately 95% of a message from a video, compared to only about 10% when reading text.
How can AI tools be used in marketing?
AI has the potential to transform marketing by enhancing customer experiences through personalization, increasing marketing ROI via customer insight analysis, and automating routine tasks. It can be effectively used to generate infographic videos from straightforward datasets.


 Haier Launches World's Lightest AI Sports Exoskeleton Robot, Weighing Just 1.75 kg
Haier Group has introduced the world's lightest AI-powered exoskeleton robot for sports — the Haier Exoskeleton Robot W3. This launch sets a new industry record for lightness, marking a major breakthrough in lightweight design and intelligent human m
Haier Launches World's Lightest AI Sports Exoskeleton Robot, Weighing Just 1.75 kg
Haier Group has introduced the world's lightest AI-powered exoskeleton robot for sports — the Haier Exoskeleton Robot W3. This launch sets a new industry record for lightness, marking a major breakthrough in lightweight design and intelligent human m
 Yaoke Media's First AIGC Drama 'The Mystery of the Bronze in Qinling' Launches Today with AI-Signed Leads
Today marks the official launch of Yaoke Media's AIGC fantasy mystery short drama, "The Secret Story of the Qinling Bronze." Starring the company's first two signed AI actors, Qin Lingyue and Lin Xiyanyan, the story unfolds in the enigmatic Qinling m
Yaoke Media's First AIGC Drama 'The Mystery of the Bronze in Qinling' Launches Today with AI-Signed Leads
Today marks the official launch of Yaoke Media's AIGC fantasy mystery short drama, "The Secret Story of the Qinling Bronze." Starring the company's first two signed AI actors, Qin Lingyue and Lin Xiyanyan, the story unfolds in the enigmatic Qinling m
 Satya Nadella ready to exploit new OpenAI deal
On Wednesday, a Wall Street analyst asked Microsoft CEO Satya Nadella directly how the revised OpenAI partnership would affect the company’s financials.Nadella described the new agreement as a win for everyone. “We feel good about our partnership wit
Satya Nadella ready to exploit new OpenAI deal
On Wednesday, a Wall Street analyst asked Microsoft CEO Satya Nadella directly how the revised OpenAI partnership would affect the company’s financials.Nadella described the new agreement as a win for everyone. “We feel good about our partnership wit
2026 Latest Best AI Expense Trackers: Top-rated tools to scan receipts & categorize corporate spend automatically. Discover powerful, game-changing solutions for effortless expense management, accurate financial tracking, and streamlined compliance. Our curated, weekly-updated comparison of free vs paid options helps you find the perfect fit. Unlock your AI edge with XIX.AI's expert picks.
10 tools
xix.ai
Discover the 2026 latest top-rated AI recruiting tools on XIX.AI. Our curated list features powerful, game-changing solutions for screening resumes and automating candidate interview scheduling. Compare free vs paid options with real-world tests and weekly updated rankings. Find your perfect hiring assistant and streamline your recruitment today!
10 tools
xix.ai
Discover the 2026 best AI personal wellness and focus coaches on XIX.AI. Our curated rankings feature top-rated, game-changing tools to manage burnout and boost mental energy. Compare free vs paid options with real-world insights. Unlock your path to peak productivity and well-being today.
10 tools
xix.ai
Discover the 2026 latest top-rated AI romantic chatbots for building genuine, long-term connections. Our curated list features powerful, consistent personalities, free vs paid comparisons, and real-world tests. Find your perfect companion and start building today at XIX.AI.
10 tools
xix.ai

Discover the 2026 best AI data science mentors to master SQL, Pandas & ML workflows. Explore our top-rated, curated selection at XIX.AI for powerful, game-changing guidance. Compare free vs paid options with real-world insights. Unlock your data science mastery today.
10 tools
xix.ai

Discover the 2026 best AI flirting and conversation trainers on XIX.AI. Our curated, top-rated selection helps you build social charisma and confidence in real-time. Explore must-try, game-changing tools with free vs paid comparisons and weekly updated rankings. Unlock your social edge today.
10 tools
xix.ai

Не уверен, что это так уж революционно... Инфографика и так повсюду, а тут ещё и ИИ подключают. Интересно, насколько качественным будет результат? Или это очередная попытка автоматизировать творческий процесс, который требует человеческого подхода? 🤔