vizGPT Product Information
Ever wondered what vizGPT is all about? It's a pretty cool tool that turns your messy data into stunning, interactive visual charts. Imagine being able to chat with your data and watch as it transforms into easy-to-understand visuals right before your eyes. That's what vizGPT does, using some fancy models like chartGPT, vizGPT, text2viz, and text2chart to make sense of your text and spit out meaningful graphics.
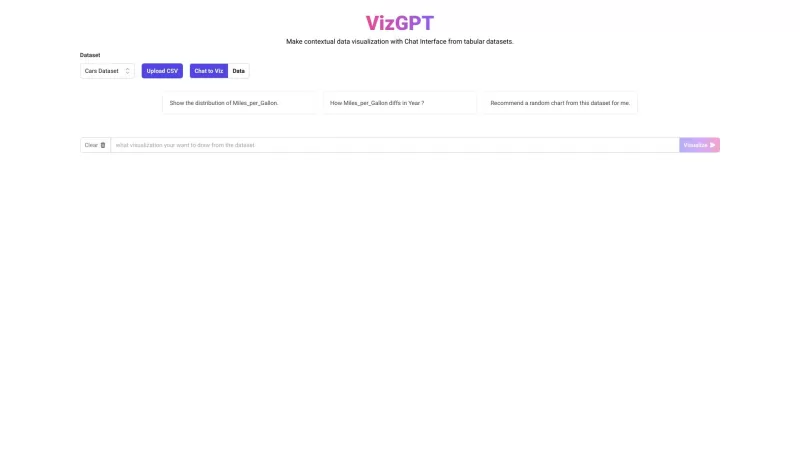
How to Use vizGPT?
Getting started with vizGPT is as easy as having a conversation. Just pop your data into the chat interface and start talking. The tool will take your text, chew on it a bit, and then serve up some interactive visualizations. Want to tweak things? No problem. You can specify the types of charts you want, fiddle with dimensions, colors, and labels until you're happy with the result. It's like having a personal data artist at your fingertips!
vizGPT's Core Features
What makes vizGPT stand out? For starters, it uses natural language processing to understand your data context, which is pretty neat. Then, it whips up those interactive charts using its advanced models. You can customize everything from the chart type to the colors, making sure your visuals are exactly how you want them. Plus, the chat interface is super intuitive, and the visualizations update in real-time as you chat. It's like watching your data come to life!
vizGPT's Use Cases
So, where can you use vizGPT? The possibilities are endless! You could use it to make sense of those dry business reports, turn survey responses into colorful charts, or even explore trends in social media chatter. It's perfect for transforming research findings into eye-catching presentations or helping you make decisions with clear visual insights. Whether you're a business analyst, a researcher, or just someone who loves playing with data, vizGPT has got you covered.
FAQ from vizGPT
- ### What types of visualizations can vizGPT generate?
- vizGPT can generate a wide range of visualizations, from simple bar and line charts to more complex scatter plots and heatmaps.
- ### Can I customize the appearance of the visual charts?
- Absolutely! You can tweak everything from chart types, dimensions, colors, to labels to make your visualizations uniquely yours.
- ### Is real-time visualization possible with vizGPT?
- Yes, indeed! As you chat and refine your data, vizGPT updates the visuals in real-time, making it a dynamic experience.
- ### What kind of data can I visualize using vizGPT?
- You can visualize almost any type of data, from numerical data to categorical data, and even textual data that can be converted into visual insights.
- ### Can vizGPT handle large datasets?
- Yes, vizGPT is designed to handle large datasets efficiently, ensuring your visualizations are both quick and accurate.
Need help with vizGPT? Shoot an email to [email protected] for customer support. The folks at Kanaries Data, Inc., the brains behind vizGPT, are ready to assist you.
Want to dive in? Log in to vizGPT at https://vizgpt.ai/signin. Curious about pricing? Check out the details at https://vizgpt.ai/pricing. And if you're the tech-savvy type, take a peek at their GitHub at https://github.com/Kanaries.
vizGPT Screenshot
vizGPT Reviews
Would you recommend vizGPT? Post your comment