Home
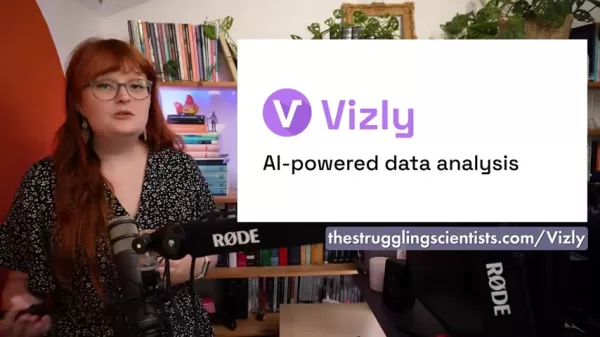
HomeVizly: Comprehensive AI Data Analysis Tool Reviewed for PhD Researchers
Data analysis is a crucial component of any PhD research, but it doesn't have to be a daunting task. What if you could bypass the steep learning curve of coding and dive straight into gaining insights from your data? That's where AI-powered tools like Vizly come into play, promising to simplify the data analysis process. In this comprehensive review, we'll explore Vizly's features, usability, pricing, and its overall value for PhD researchers, along with some exclusive insights on how to make the most of this tool.
What is Vizly?
Data analysis often feels like a mountain to climb for many PhD students, with hours spent learning complex coding and statistical software just to make sense of their data. Vizly aims to change that narrative by offering an AI-powered solution that makes data analysis more accessible. Designed especially for those without deep coding knowledge, Vizly features a user-friendly interface where you can upload your data and interact with it through a chatbot-like system. This means you can ask questions and get visualizations without writing a single line of code.

What We'll Cover in This Review
As part of The Struggling Scientists' 'PhD's Toolkit' series, this review will help you decide if Vizly is the right fit for your research needs. We'll be looking at:
- Function: How effectively does Vizly handle data analysis and visualization?
- Ease of Use: Is the tool accessible, particularly for those with limited coding skills?
- Pricing: What are the subscription options, and how affordable are they for PhD students?
- Significance: How much can Vizly streamline the research process for academics?
Vizly's User Interface: A Tour
Let's take a closer look at Vizly's user interface, which is crafted to be intuitive and easy to navigate. Head over to thestrugglingscientists.com/Vizly to sign up for an account. You'll find various sign-up options including Google, Microsoft, Apple, or email registration. Once you're in, the chatbot-like interface greets you, similar to what you might know from tools like ChatGPT.
To get started, upload your data file. Vizly accepts multiple formats like CSV and XLSX, and you can either connect to a Google Sheet or upload directly from your computer. From there, you're ready to ask your data questions and uncover insights.
Wondering about data security? Vizly keeps your data safe by creating a separate sandbox environment for each user, and for added peace of mind, it automatically deletes your data after an hour of inactivity.

Vizly Data Security
Data Protection Measures
When it comes to handling sensitive research data, security is non-negotiable. Here's how Vizly ensures your data stays safe:
- Sandbox Environment: Each user gets their own secure sandbox, meaning your data files and analyses are accessible only to you.
- Automatic Data Deletion: Vizly deletes any uploaded data files after one hour of inactivity, ensuring your data doesn't linger on their servers longer than necessary.
How to Analyze Data with Vizly: A Quick Start Guide
Step 1: Upload Your Data
Log into your Vizly account and hit the 'Select a data source' button to upload your data file. The tool supports various formats, making it easy to get your data in.
Step 2: Select Analysis and Coding Preference
Choose which AI large language model you want to use and select your preferred coding language, either Python or R.

Step 3: Ask Questions and Generate Insights
Now, you can pose questions about your data using natural language. Vizly will provide insightful responses, along with visualizations and code snippets. Keep refining your questions to get the most accurate and relevant results.
Step 4: Customize and Export Your Visualizations
Once you've created your visualizations, you can customize them by adjusting colors, titles, axes, and other variables. Export them in formats like PNG, PDF, or HTML to share with your team or supervisors.
Vizly Pricing Plans: Finding the Right Option for Your Research
Vizly Subscription Options
Vizly offers various plans to suit different needs and budgets:
- Trial (Free): Up to 10 messages per month with accurate AI models. Note that files are deleted after 1 hour of inactivity.
- Basic ($19.99/month): Up to 200 messages per month and access to top-tier models. Billed at $16.67/month annually for a 17% discount.
- Premium ($29.99/month): Unlimited messages, high-performance coding environments, advanced memory retention, and priority support. Billed at $25.00/month annually for a 17% discount.
Students can reach out to Vizly for a 25% discount. Plus, as a reader of The Struggling Scientists, you can enjoy a 20% discount on your Vizly subscription by using this link: thestrugglingscientists.com/Vizly.
Vizly: Weighing the Pros and Cons
Pros
- User-friendly chatbot interface makes data analysis accessible to those without coding skills.
- AI-powered insights help identify trends and patterns quickly, saving time and effort.
- Automatic data deletion and sandbox environments ensure data privacy.
- Cloud-based accessibility allows researchers to work from anywhere with an internet connection.
Cons
- The free trial's limited messages may necessitate a paid subscription for extensive use.
- Some users might prefer more traditional data analysis interfaces.
- Researchers working with medical data may find limitations in Vizly's capabilities.
Core Features
Data Analysis and AI
Vizly stands out with its robust data analysis capabilities. Upload your data, ask the AI for insights, and get reproducible code and stunning visual outputs to include in your research papers.
Data Privacy and Security
In fields like STEM, data privacy is critical. Vizly's secure sandbox environments and automatic data deletion policies put it a step ahead of many competitors.
Vizly Use Cases: Empowering PhD Research
Streamlining RNA Sequencing (RNA-Seq) Data Analysis
RNA-Seq data analysis can be a complex and time-consuming process. Vizly simplifies it by allowing you to upload your data and ask specific questions about gene expression patterns, differential expression analysis, and functional enrichment. The generated code snippets also speed up the analysis, even if you're not a bioinformatics expert.
Facilitating Meta-Analyses
Meta-analyses require integrating data from multiple studies, which can be challenging. Vizly makes this easier by letting you upload multiple datasets and perform meta-analyses with ease. It identifies common trends, assesses heterogeneity, and creates summary visualizations to enhance the robustness of your research findings.
Frequently Asked Questions About Vizly
What types of data files are supported by Vizly?
Vizly supports a variety of file formats including CSV, XLSX, and more. You can connect directly to a Google Sheet or upload from your computer.
How does Vizly ensure data privacy and security?
Vizly creates a secure sandbox environment for each user and automatically deletes any uploaded data files after one hour of inactivity.
Can I customize the visualizations generated by Vizly?
Yes, you can customize the visualizations by adjusting colors, titles, axes, and other variables before exporting them in formats like PNG, PDF, or HTML.
How does Vizly compare to other data analysis tools?
Vizly sets itself apart with its AI-powered chatbot interface, focusing on simplifying data analysis for those with limited coding experience. Other tools might require more technical expertise and manual coding. Its cloud-based nature makes it highly accessible, and it simplifies data cleaning, offering a more user-friendly experience compared to many other tools on the market.
Related article
 Kakao Mobility outlines Level 4 autonomous driving roadmap for physical AI
Kakao Mobility is planning to develop Level 4 autonomous driving technologies internally as part of its physical AI strategy.
At the 2026 World IT Show conference in Seoul's COEX, Kim Jin-kyu — vice president and head of Kakao Mobility's Physical AI
Physical AI edges closer to factory floors as humanoid robots undergo trials
Humanoid, a British technology company, is set to deploy humanoid robots at factories run by German industrial supplier Schaeffler, according to Reuters.
According to a Humanoid spokesperson, the agreement is expected to bring between 1,000 and 2,000
IBM: Data Silos Remain Major Hurdle for Enterprise AI Adoption
According to IBM's research, the main obstacle to enterprise AI adoption isn't the underlying technology, but the persistent challenge of fractured data ecosystems.Ed Lovely, VP and Chief Data Officer at IBM, identifies data silos as the critical vul
Related Special Topic Recommendations
Comic Creation
Kakao Mobility outlines Level 4 autonomous driving roadmap for physical AI
Kakao Mobility is planning to develop Level 4 autonomous driving technologies internally as part of its physical AI strategy.
At the 2026 World IT Show conference in Seoul's COEX, Kim Jin-kyu — vice president and head of Kakao Mobility's Physical AI
Physical AI edges closer to factory floors as humanoid robots undergo trials
Humanoid, a British technology company, is set to deploy humanoid robots at factories run by German industrial supplier Schaeffler, according to Reuters.
According to a Humanoid spokesperson, the agreement is expected to bring between 1,000 and 2,000
IBM: Data Silos Remain Major Hurdle for Enterprise AI Adoption
According to IBM's research, the main obstacle to enterprise AI adoption isn't the underlying technology, but the persistent challenge of fractured data ecosystems.Ed Lovely, VP and Chief Data Officer at IBM, identifies data silos as the critical vul
Related Special Topic Recommendations
Comic Creation
 Top AI Generators for Shonen Manga: Create High-Octane Action Sequences & Energy Effects
Discover the 2026 best AI generators for Shonen manga at XIX.AI. Our top-rated, curated list features powerful tools for creating high-octane action sequences and dynamic energy effects. Compare free vs paid options with real-world tests. Unlock your creative potential and start crafting epic manga today!
 15 tools
 xix.ai
Business
Best AI Expense Trackers: Scan Receipts & Categorize Corporate Spend Automatically
xix.ai
Business
Best AI Expense Trackers: Scan Receipts & Categorize Corporate Spend Automatically
2026 Latest Best AI Expense Trackers: Top-rated tools to scan receipts & categorize corporate spend automatically. Discover powerful, game-changing solutions for effortless expense management, accurate financial tracking, and streamlined compliance. Our curated, weekly-updated comparison of free vs paid options helps you find the perfect fit. Unlock your AI edge with XIX.AI's expert picks.
10 tools
xix.ai
Business
Best AI Recruiting Tools: Screen Resumes & Automate Candidate Interview Scheduling
Discover the 2026 latest top-rated AI recruiting tools on XIX.AI. Our curated list features powerful, game-changing solutions for screening resumes and automating candidate interview scheduling. Compare free vs paid options with real-world tests and weekly updated rankings. Find your perfect hiring assistant and streamline your recruitment today!
10 tools
xix.ai
Productivity
AI Personal Wellness & Focus Coaches: Manage Burnout & Boost Mental Energy Levels
Discover the 2026 best AI personal wellness and focus coaches on XIX.AI. Our curated rankings feature top-rated, game-changing tools to manage burnout and boost mental energy. Compare free vs paid options with real-world insights. Unlock your path to peak productivity and well-being today.
10 tools
xix.ai
chatbot
Top-Rated AI Romantic Chatbots: Build Long-Term Relationships with Consistent Personalities
Discover the 2026 latest top-rated AI romantic chatbots for building genuine, long-term connections. Our curated list features powerful, consistent personalities, free vs paid comparisons, and real-world tests. Find your perfect companion and start building today at XIX.AI.
10 tools
xix.ai
Education and Learning
Best AI Data Science Mentors: Master SQL, Pandas & Machine Learning Workflows
Discover the 2026 best AI data science mentors to master SQL, Pandas & ML workflows. Explore our top-rated, curated selection at XIX.AI for powerful, game-changing guidance. Compare free vs paid options with real-world insights. Unlock your data science mastery today.
10 tools
xix.ai

 Comments (8)
0/500
Comments (8)
0/500
![StevenWalker]()
Не уверен, что это сработает для сложных исследований. В моей диссертации по квантовой физике пришлось писать кастомные алгоритмы - сомневаюсь, что ИИ справится с такими специфичными задачами 🤔 Может, для социологии подойдёт?
![SebastianAnderson]()
Un análisis de datos 'tan fácil que hasta mi gato podría hacerlo'? 🤯 Suena demasiado bueno para ser verdad. Me pregunto hasta qué punto realmente pueden captar el contexto específico de cada disciplina de doctorado. ¿Y qué pasa con la reproducibilidad? Si nadie ve el código detrás, ¿cómo verifico los resultados para mi tesis? Aún así, la idea de ahorrar tiempo en limpieza de datos es tentadísima. Tal vez dé una oportunidad a la versión gratuita para ver si soporta datasets complejos.
![GeorgeMartinez]()
これはPhDの学生向けに特化したAI分析ツールなんですね。コーディング不要でデータ分析ができるなんて便利そう!でも出力結果の解釈を間違えたら論文に影響出そうで少し心配😅 類似ツールとの比較記事も読んでみたいです。
![FredAllen]()
Interesante herramienta para investigación académica. ¿Pero hasta qué punto podemos confiar en los resultados generados por IA sin entender el código detrás? 🤔 Sería útil ver una comparación con análisis estadísticos tradicionales.
![WilliamAnderson]()
Vizly sounds like a game-changer for PhD researchers! I love how it skips the coding hassle and jumps right to insights. Anyone tried it for complex datasets yet? 😄
![RoyGarcía]()
Vizly sounds like a game-changer for PhD students! No coding hassle and quick insights? Count me in! 😎 Curious how it stacks up against traditional tools like SPSS for complex datasets.
Data analysis is a crucial component of any PhD research, but it doesn't have to be a daunting task. What if you could bypass the steep learning curve of coding and dive straight into gaining insights from your data? That's where AI-powered tools like Vizly come into play, promising to simplify the data analysis process. In this comprehensive review, we'll explore Vizly's features, usability, pricing, and its overall value for PhD researchers, along with some exclusive insights on how to make the most of this tool.
What is Vizly?
Data analysis often feels like a mountain to climb for many PhD students, with hours spent learning complex coding and statistical software just to make sense of their data. Vizly aims to change that narrative by offering an AI-powered solution that makes data analysis more accessible. Designed especially for those without deep coding knowledge, Vizly features a user-friendly interface where you can upload your data and interact with it through a chatbot-like system. This means you can ask questions and get visualizations without writing a single line of code.
What We'll Cover in This Review
As part of The Struggling Scientists' 'PhD's Toolkit' series, this review will help you decide if Vizly is the right fit for your research needs. We'll be looking at:
- Function: How effectively does Vizly handle data analysis and visualization?
- Ease of Use: Is the tool accessible, particularly for those with limited coding skills?
- Pricing: What are the subscription options, and how affordable are they for PhD students?
- Significance: How much can Vizly streamline the research process for academics?
Vizly's User Interface: A Tour
Let's take a closer look at Vizly's user interface, which is crafted to be intuitive and easy to navigate. Head over to thestrugglingscientists.com/Vizly to sign up for an account. You'll find various sign-up options including Google, Microsoft, Apple, or email registration. Once you're in, the chatbot-like interface greets you, similar to what you might know from tools like ChatGPT.
To get started, upload your data file. Vizly accepts multiple formats like CSV and XLSX, and you can either connect to a Google Sheet or upload directly from your computer. From there, you're ready to ask your data questions and uncover insights.
Wondering about data security? Vizly keeps your data safe by creating a separate sandbox environment for each user, and for added peace of mind, it automatically deletes your data after an hour of inactivity.
Vizly Data Security
Data Protection Measures
When it comes to handling sensitive research data, security is non-negotiable. Here's how Vizly ensures your data stays safe:
- Sandbox Environment: Each user gets their own secure sandbox, meaning your data files and analyses are accessible only to you.
- Automatic Data Deletion: Vizly deletes any uploaded data files after one hour of inactivity, ensuring your data doesn't linger on their servers longer than necessary.
How to Analyze Data with Vizly: A Quick Start Guide
Step 1: Upload Your Data
Log into your Vizly account and hit the 'Select a data source' button to upload your data file. The tool supports various formats, making it easy to get your data in.
Step 2: Select Analysis and Coding Preference
Choose which AI large language model you want to use and select your preferred coding language, either Python or R.
Step 3: Ask Questions and Generate Insights
Now, you can pose questions about your data using natural language. Vizly will provide insightful responses, along with visualizations and code snippets. Keep refining your questions to get the most accurate and relevant results.
Step 4: Customize and Export Your Visualizations
Once you've created your visualizations, you can customize them by adjusting colors, titles, axes, and other variables. Export them in formats like PNG, PDF, or HTML to share with your team or supervisors.
Vizly Pricing Plans: Finding the Right Option for Your Research
Vizly Subscription Options
Vizly offers various plans to suit different needs and budgets:
- Trial (Free): Up to 10 messages per month with accurate AI models. Note that files are deleted after 1 hour of inactivity.
- Basic ($19.99/month): Up to 200 messages per month and access to top-tier models. Billed at $16.67/month annually for a 17% discount.
- Premium ($29.99/month): Unlimited messages, high-performance coding environments, advanced memory retention, and priority support. Billed at $25.00/month annually for a 17% discount.
Students can reach out to Vizly for a 25% discount. Plus, as a reader of The Struggling Scientists, you can enjoy a 20% discount on your Vizly subscription by using this link: thestrugglingscientists.com/Vizly.
Vizly: Weighing the Pros and Cons
Pros
- User-friendly chatbot interface makes data analysis accessible to those without coding skills.
- AI-powered insights help identify trends and patterns quickly, saving time and effort.
- Automatic data deletion and sandbox environments ensure data privacy.
- Cloud-based accessibility allows researchers to work from anywhere with an internet connection.
Cons
- The free trial's limited messages may necessitate a paid subscription for extensive use.
- Some users might prefer more traditional data analysis interfaces.
- Researchers working with medical data may find limitations in Vizly's capabilities.
Core Features
Data Analysis and AI
Vizly stands out with its robust data analysis capabilities. Upload your data, ask the AI for insights, and get reproducible code and stunning visual outputs to include in your research papers.
Data Privacy and Security
In fields like STEM, data privacy is critical. Vizly's secure sandbox environments and automatic data deletion policies put it a step ahead of many competitors.
Vizly Use Cases: Empowering PhD Research
Streamlining RNA Sequencing (RNA-Seq) Data Analysis
RNA-Seq data analysis can be a complex and time-consuming process. Vizly simplifies it by allowing you to upload your data and ask specific questions about gene expression patterns, differential expression analysis, and functional enrichment. The generated code snippets also speed up the analysis, even if you're not a bioinformatics expert.
Facilitating Meta-Analyses
Meta-analyses require integrating data from multiple studies, which can be challenging. Vizly makes this easier by letting you upload multiple datasets and perform meta-analyses with ease. It identifies common trends, assesses heterogeneity, and creates summary visualizations to enhance the robustness of your research findings.
Frequently Asked Questions About Vizly
What types of data files are supported by Vizly?
Vizly supports a variety of file formats including CSV, XLSX, and more. You can connect directly to a Google Sheet or upload from your computer.
How does Vizly ensure data privacy and security?
Vizly creates a secure sandbox environment for each user and automatically deletes any uploaded data files after one hour of inactivity.
Can I customize the visualizations generated by Vizly?
Yes, you can customize the visualizations by adjusting colors, titles, axes, and other variables before exporting them in formats like PNG, PDF, or HTML.
How does Vizly compare to other data analysis tools?
Vizly sets itself apart with its AI-powered chatbot interface, focusing on simplifying data analysis for those with limited coding experience. Other tools might require more technical expertise and manual coding. Its cloud-based nature makes it highly accessible, and it simplifies data cleaning, offering a more user-friendly experience compared to many other tools on the market.


 Kakao Mobility outlines Level 4 autonomous driving roadmap for physical AI
Kakao Mobility is planning to develop Level 4 autonomous driving technologies internally as part of its physical AI strategy.
At the 2026 World IT Show conference in Seoul's COEX, Kim Jin-kyu — vice president and head of Kakao Mobility's Physical AI
Physical AI edges closer to factory floors as humanoid robots undergo trials
Humanoid, a British technology company, is set to deploy humanoid robots at factories run by German industrial supplier Schaeffler, according to Reuters.
According to a Humanoid spokesperson, the agreement is expected to bring between 1,000 and 2,000
Kakao Mobility outlines Level 4 autonomous driving roadmap for physical AI
Kakao Mobility is planning to develop Level 4 autonomous driving technologies internally as part of its physical AI strategy.
At the 2026 World IT Show conference in Seoul's COEX, Kim Jin-kyu — vice president and head of Kakao Mobility's Physical AI
Physical AI edges closer to factory floors as humanoid robots undergo trials
Humanoid, a British technology company, is set to deploy humanoid robots at factories run by German industrial supplier Schaeffler, according to Reuters.
According to a Humanoid spokesperson, the agreement is expected to bring between 1,000 and 2,000
 IBM: Data Silos Remain Major Hurdle for Enterprise AI Adoption
According to IBM's research, the main obstacle to enterprise AI adoption isn't the underlying technology, but the persistent challenge of fractured data ecosystems.Ed Lovely, VP and Chief Data Officer at IBM, identifies data silos as the critical vul
IBM: Data Silos Remain Major Hurdle for Enterprise AI Adoption
According to IBM's research, the main obstacle to enterprise AI adoption isn't the underlying technology, but the persistent challenge of fractured data ecosystems.Ed Lovely, VP and Chief Data Officer at IBM, identifies data silos as the critical vul

Discover the 2026 best AI generators for Shonen manga at XIX.AI. Our top-rated, curated list features powerful tools for creating high-octane action sequences and dynamic energy effects. Compare free vs paid options with real-world tests. Unlock your creative potential and start crafting epic manga today!
15 tools
xix.ai

2026 Latest Best AI Expense Trackers: Top-rated tools to scan receipts & categorize corporate spend automatically. Discover powerful, game-changing solutions for effortless expense management, accurate financial tracking, and streamlined compliance. Our curated, weekly-updated comparison of free vs paid options helps you find the perfect fit. Unlock your AI edge with XIX.AI's expert picks.
10 tools
xix.ai

Discover the 2026 latest top-rated AI recruiting tools on XIX.AI. Our curated list features powerful, game-changing solutions for screening resumes and automating candidate interview scheduling. Compare free vs paid options with real-world tests and weekly updated rankings. Find your perfect hiring assistant and streamline your recruitment today!
10 tools
xix.ai
Discover the 2026 best AI personal wellness and focus coaches on XIX.AI. Our curated rankings feature top-rated, game-changing tools to manage burnout and boost mental energy. Compare free vs paid options with real-world insights. Unlock your path to peak productivity and well-being today.
10 tools
xix.ai

Discover the 2026 latest top-rated AI romantic chatbots for building genuine, long-term connections. Our curated list features powerful, consistent personalities, free vs paid comparisons, and real-world tests. Find your perfect companion and start building today at XIX.AI.
10 tools
xix.ai
Discover the 2026 best AI data science mentors to master SQL, Pandas & ML workflows. Explore our top-rated, curated selection at XIX.AI for powerful, game-changing guidance. Compare free vs paid options with real-world insights. Unlock your data science mastery today.
10 tools
xix.ai

Не уверен, что это сработает для сложных исследований. В моей диссертации по квантовой физике пришлось писать кастомные алгоритмы - сомневаюсь, что ИИ справится с такими специфичными задачами 🤔 Может, для социологии подойдёт?
Un análisis de datos 'tan fácil que hasta mi gato podría hacerlo'? 🤯 Suena demasiado bueno para ser verdad. Me pregunto hasta qué punto realmente pueden captar el contexto específico de cada disciplina de doctorado. ¿Y qué pasa con la reproducibilidad? Si nadie ve el código detrás, ¿cómo verifico los resultados para mi tesis? Aún así, la idea de ahorrar tiempo en limpieza de datos es tentadísima. Tal vez dé una oportunidad a la versión gratuita para ver si soporta datasets complejos.
これはPhDの学生向けに特化したAI分析ツールなんですね。コーディング不要でデータ分析ができるなんて便利そう!でも出力結果の解釈を間違えたら論文に影響出そうで少し心配😅 類似ツールとの比較記事も読んでみたいです。
Interesante herramienta para investigación académica. ¿Pero hasta qué punto podemos confiar en los resultados generados por IA sin entender el código detrás? 🤔 Sería útil ver una comparación con análisis estadísticos tradicionales.
Vizly sounds like a game-changer for PhD researchers! I love how it skips the coding hassle and jumps right to insights. Anyone tried it for complex datasets yet? 😄
Vizly sounds like a game-changer for PhD students! No coding hassle and quick insights? Count me in! 😎 Curious how it stacks up against traditional tools like SPSS for complex datasets.