Home
HomeDiscover the Future of Data Analysis: Explore Power BI's Advanced AI Capabilities
Unlocking the Power of AI in Power BI: Smarter Data Analysis Made Easy
Power BI isn’t just another data visualization tool—it’s a game-changer, especially when you tap into its AI capabilities. Whether you're a data analyst, business user, or just someone looking to make sense of numbers faster, Power BI’s AI-powered features can help you uncover hidden patterns, predict trends, and even analyze text sentiment—all without needing deep technical expertise.
Let’s dive into some of the most powerful AI-driven tools Power BI offers and how they can transform the way you work with data.
1. Quick Insights: Instant Data Discovery
Ever stared at a massive dataset, unsure where to start? Quick Insights is your AI-powered assistant that scans your data and highlights key trends, correlations, and outliers—in seconds.
Why It’s Useful:
- No DAX or complex queries needed—just click and let AI do the work.
- Suggests visualizations you might not have considered.
- Identifies hidden patterns, like sudden spikes in sales or unusual drops in performance.
How to Use It:
- Open Power BI Service.
- Hover over your dataset and click "Get Quick Insights."
- Watch as Power BI generates charts, scatter plots, and trend lines—all pointing to the most interesting parts of your data.
Best for: Exploratory analysis when you don’t yet know what questions to ask.
2. Analyze Feature: AI-Powered Data Explanations
Ever wondered why a sales number suddenly spiked or why customer engagement dropped? The Analyze Feature helps you understand the "why" behind data changes.

How It Works:
- Select a data point in a chart (like a bar or line graph).
- Right-click and choose "Analyze" > "Explain the increase/decrease."
- Power BI instantly suggests possible reasons, like seasonality, regional differences, or product performance.
Best for: Quickly diagnosing trends without manual digging.
3. AI Visuals: Q&A & Decomposition Tree
Q&A: Ask Your Data in Plain English
Want to query your data without writing a single formula? Just type a question like:
- "What were total sales last quarter?"
- "Which region has the highest customer churn?"
Power BI generates the right visualization on the fly.
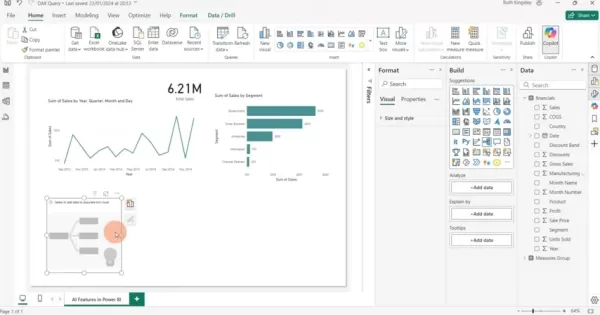
Decomposition Tree: Break Down Data Like a Pro
Need to see how different factors impact a metric? The Decomposition Tree lets you drill into data across multiple dimensions—like sales by region, product, and time—with a simple click.
Best for: Interactive, self-service analytics.
4. Text Analytics: Extract Meaning from Customer Feedback
Customer reviews, social media comments, and survey responses hold valuable insights—but manually analyzing them is tedious. Power BI’s Text Analytics (powered by Azure Cognitive Services) automates sentiment analysis, key phrase extraction, and language detection.
How to Use It:
- Open Power Query Editor.
- Select a text column (e.g., customer reviews).
- Click "Add Column" > "Text Analytics" and choose:
- Sentiment Score (positive/negative/neutral)
- Key Phrases (most important words)
- Language Detection
Best for: Understanding customer sentiment without manual tagging.
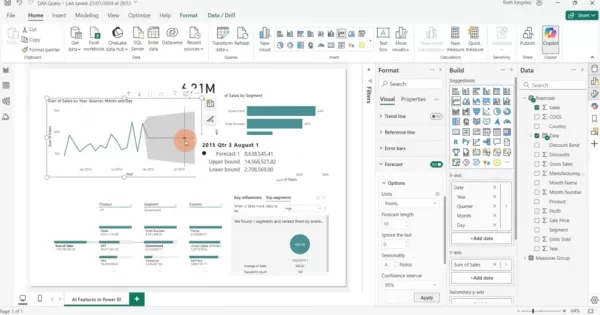
5. AI-Powered Forecasting: Predict Future Trends
Want to forecast sales, demand, or inventory needs? Power BI’s Forecasting tool uses historical data to predict future trends.
How to Set It Up:
- Create a time-based visual (like a line chart).
- Toggle "Forecast" in the Format pane.
- Adjust forecast length and confidence intervals.
Best for: Budgeting, inventory planning, and trend predictions.
The Pros & Cons of Power BI AI
✅ Pros
✔ Faster analysis—AI does the heavy lifting.
✔ Uncovers hidden insights you might miss manually.
✔ Natural language queries make data accessible to everyone.
✔ Sentiment analysis helps understand customer emotions.
✔ Forecasting aids in smarter business planning.
❌ Cons
✖ Data quality matters—garbage in, garbage out.
✖ Requires Azure Cognitive Services for text analytics.
✖ Overfitting risk—AI models can misinterpret noisy data.
FAQs
❓ What data works best with Quick Insights?
Large datasets with multiple fields (numeric + categorical). Simple datasets may not yield meaningful results.
❓ How accurate is Power BI’s forecasting?
It depends on historical data quality. More data = better predictions. External factors (like market changes) aren’t always captured.
❓ Can I analyze text in different languages?
Yes! Just specify the language code (e.g., "en" for English, "es" for Spanish).
Final Thoughts
Power BI’s AI tools democratize data analysis, making it faster and more intuitive. Whether you’re predicting sales, analyzing customer sentiment, or just exploring data, these features help you work smarter, not harder.
Ready to try them out? Open Power BI and start experimenting—you might be surprised at what your data can tell you! 🚀
Related article
 Yaoke Media's First AIGC Drama 'The Mystery of the Bronze in Qinling' Launches Today with AI-Signed Leads
Today marks the official launch of Yaoke Media's AIGC fantasy mystery short drama, "The Secret Story of the Qinling Bronze." Starring the company's first two signed AI actors, Qin Lingyue and Lin Xiyanyan, the story unfolds in the enigmatic Qinling m
Satya Nadella ready to exploit new OpenAI deal
On Wednesday, a Wall Street analyst asked Microsoft CEO Satya Nadella directly how the revised OpenAI partnership would affect the company’s financials.Nadella described the new agreement as a win for everyone. “We feel good about our partnership wit
WordPress.com now allows AI agents to write and publish posts, plus more
WordPress.com, the popular web hosting and publishing platform, is now embracing AI agents—a move that could reshape the look and feel of the web. The company announced Friday that it will allow AI agents to draft, edit, and publish content on custom
Related Special Topic Recommendations
Business
Yaoke Media's First AIGC Drama 'The Mystery of the Bronze in Qinling' Launches Today with AI-Signed Leads
Today marks the official launch of Yaoke Media's AIGC fantasy mystery short drama, "The Secret Story of the Qinling Bronze." Starring the company's first two signed AI actors, Qin Lingyue and Lin Xiyanyan, the story unfolds in the enigmatic Qinling m
Satya Nadella ready to exploit new OpenAI deal
On Wednesday, a Wall Street analyst asked Microsoft CEO Satya Nadella directly how the revised OpenAI partnership would affect the company’s financials.Nadella described the new agreement as a win for everyone. “We feel good about our partnership wit
WordPress.com now allows AI agents to write and publish posts, plus more
WordPress.com, the popular web hosting and publishing platform, is now embracing AI agents—a move that could reshape the look and feel of the web. The company announced Friday that it will allow AI agents to draft, edit, and publish content on custom
Related Special Topic Recommendations
Business
 Best AI Expense Trackers: Scan Receipts & Categorize Corporate Spend Automatically
2026 Latest Best AI Expense Trackers: Top-rated tools to scan receipts & categorize corporate spend automatically. Discover powerful, game-changing solutions for effortless expense management, accurate financial tracking, and streamlined compliance. Our curated, weekly-updated comparison of free vs paid options helps you find the perfect fit. Unlock your AI edge with XIX.AI's expert picks.
 10 tools
 xix.ai
Business
Best AI Recruiting Tools: Screen Resumes & Automate Candidate Interview Scheduling
xix.ai
Business
Best AI Recruiting Tools: Screen Resumes & Automate Candidate Interview Scheduling
Discover the 2026 latest top-rated AI recruiting tools on XIX.AI. Our curated list features powerful, game-changing solutions for screening resumes and automating candidate interview scheduling. Compare free vs paid options with real-world tests and weekly updated rankings. Find your perfect hiring assistant and streamline your recruitment today!
10 tools
xix.ai
Productivity
AI Personal Wellness & Focus Coaches: Manage Burnout & Boost Mental Energy Levels
Discover the 2026 best AI personal wellness and focus coaches on XIX.AI. Our curated rankings feature top-rated, game-changing tools to manage burnout and boost mental energy. Compare free vs paid options with real-world insights. Unlock your path to peak productivity and well-being today.
10 tools
xix.ai
chatbot
Top-Rated AI Romantic Chatbots: Build Long-Term Relationships with Consistent Personalities
Discover the 2026 latest top-rated AI romantic chatbots for building genuine, long-term connections. Our curated list features powerful, consistent personalities, free vs paid comparisons, and real-world tests. Find your perfect companion and start building today at XIX.AI.
10 tools
xix.ai
Education and Learning
Best AI Data Science Mentors: Master SQL, Pandas & Machine Learning Workflows
Discover the 2026 best AI data science mentors to master SQL, Pandas & ML workflows. Explore our top-rated, curated selection at XIX.AI for powerful, game-changing guidance. Compare free vs paid options with real-world insights. Unlock your data science mastery today.
10 tools
xix.ai
chatbot
Best AI Flirting & Conversation Trainers: Improve Social Charisma and Confidence in Real-Time
Discover the 2026 best AI flirting and conversation trainers on XIX.AI. Our curated, top-rated selection helps you build social charisma and confidence in real-time. Explore must-try, game-changing tools with free vs paid comparisons and weekly updated rankings. Unlock your social edge today.
10 tools
xix.ai

 Comments (6)
0/500
Comments (6)
0/500
![RaymondBaker]()
Power BI mit KI? Endlich mal eine Entwicklung, die nicht einfach nur Buzzwords nachplappert. Die Integration sieht durchdacht aus, aber als kleiner Analyst hoffe ich nur, dass mich das Tool nicht irgendwann ersetzt 😅. Hoffentlich bleibt die Benutzeroberfläche trotz der neuen Funktionen übersichtlich.
![StevenGonzalez]()
Power BI의 AI 기능이 진짜 실무에 도움될까요? 저는 막상 사용해보니 평범한 데이터 탐색에는 쓸만하지만, 복잡한 예측 분석에는 아직 한계가 느껴지더라구요... 🙃 그래도 평소 엑셀만 쓰던 팀원들이 쉽게 시각화해보는 계기가 된 건 좋았어요.
![RogerPerez]()
Power BI의 AI 기능이 정말 신기하네요! 데이터 분석이 이렇게 쉬워질 줄이야 😲 직장에서 보고서 작성할 때 써보면 엄청 시간 절약될 것 같아요. 근데 AI가 점점 발전하다보면 데이터 분석직종은 어떻게 변하게 될지 궁금해지기도 하네...
![JasonRamirez]()
Power BI's AI sounds like a data wizard! 🧙♂️ Makes me wonder if it can predict my coffee consumption trends too. Super cool for analysts!
![JustinLewis]()
Power BI's AI features sound like a total game-changer! I'm curious how it handles real-time data crunching for small businesses—any cool examples out there? 😎
![JackHernández]()
Power BI's AI features sound like a data nerd's dream! 🚀 I'm curious—how easy is it for a beginner to actually use these tools without getting lost in the tech jungle?
Unlocking the Power of AI in Power BI: Smarter Data Analysis Made Easy
Power BI isn’t just another data visualization tool—it’s a game-changer, especially when you tap into its AI capabilities. Whether you're a data analyst, business user, or just someone looking to make sense of numbers faster, Power BI’s AI-powered features can help you uncover hidden patterns, predict trends, and even analyze text sentiment—all without needing deep technical expertise.
Let’s dive into some of the most powerful AI-driven tools Power BI offers and how they can transform the way you work with data.
1. Quick Insights: Instant Data Discovery
Ever stared at a massive dataset, unsure where to start? Quick Insights is your AI-powered assistant that scans your data and highlights key trends, correlations, and outliers—in seconds.
Why It’s Useful:
- No DAX or complex queries needed—just click and let AI do the work.
- Suggests visualizations you might not have considered.
- Identifies hidden patterns, like sudden spikes in sales or unusual drops in performance.
How to Use It:
- Open Power BI Service.
- Hover over your dataset and click "Get Quick Insights."
- Watch as Power BI generates charts, scatter plots, and trend lines—all pointing to the most interesting parts of your data.
Best for: Exploratory analysis when you don’t yet know what questions to ask.
2. Analyze Feature: AI-Powered Data Explanations
Ever wondered why a sales number suddenly spiked or why customer engagement dropped? The Analyze Feature helps you understand the "why" behind data changes.
How It Works:
- Select a data point in a chart (like a bar or line graph).
- Right-click and choose "Analyze" > "Explain the increase/decrease."
- Power BI instantly suggests possible reasons, like seasonality, regional differences, or product performance.
Best for: Quickly diagnosing trends without manual digging.
3. AI Visuals: Q&A & Decomposition Tree
Q&A: Ask Your Data in Plain English
Want to query your data without writing a single formula? Just type a question like:
- "What were total sales last quarter?"
- "Which region has the highest customer churn?"
Power BI generates the right visualization on the fly.
Decomposition Tree: Break Down Data Like a Pro
Need to see how different factors impact a metric? The Decomposition Tree lets you drill into data across multiple dimensions—like sales by region, product, and time—with a simple click.
Best for: Interactive, self-service analytics.
4. Text Analytics: Extract Meaning from Customer Feedback
Customer reviews, social media comments, and survey responses hold valuable insights—but manually analyzing them is tedious. Power BI’s Text Analytics (powered by Azure Cognitive Services) automates sentiment analysis, key phrase extraction, and language detection.
How to Use It:
- Open Power Query Editor.
- Select a text column (e.g., customer reviews).
- Click "Add Column" > "Text Analytics" and choose:
- Sentiment Score (positive/negative/neutral)
- Key Phrases (most important words)
- Language Detection
Best for: Understanding customer sentiment without manual tagging.
5. AI-Powered Forecasting: Predict Future Trends
Want to forecast sales, demand, or inventory needs? Power BI’s Forecasting tool uses historical data to predict future trends.
How to Set It Up:
- Create a time-based visual (like a line chart).
- Toggle "Forecast" in the Format pane.
- Adjust forecast length and confidence intervals.
Best for: Budgeting, inventory planning, and trend predictions.
The Pros & Cons of Power BI AI
✅ Pros
✔ Faster analysis—AI does the heavy lifting.
✔ Uncovers hidden insights you might miss manually.
✔ Natural language queries make data accessible to everyone.
✔ Sentiment analysis helps understand customer emotions.
✔ Forecasting aids in smarter business planning.
❌ Cons
✖ Data quality matters—garbage in, garbage out.
✖ Requires Azure Cognitive Services for text analytics.
✖ Overfitting risk—AI models can misinterpret noisy data.
FAQs
❓ What data works best with Quick Insights?
Large datasets with multiple fields (numeric + categorical). Simple datasets may not yield meaningful results.
❓ How accurate is Power BI’s forecasting?
It depends on historical data quality. More data = better predictions. External factors (like market changes) aren’t always captured.
❓ Can I analyze text in different languages?
Yes! Just specify the language code (e.g., "en" for English, "es" for Spanish).
Final Thoughts
Power BI’s AI tools democratize data analysis, making it faster and more intuitive. Whether you’re predicting sales, analyzing customer sentiment, or just exploring data, these features help you work smarter, not harder.
Ready to try them out? Open Power BI and start experimenting—you might be surprised at what your data can tell you! 🚀


 Yaoke Media's First AIGC Drama 'The Mystery of the Bronze in Qinling' Launches Today with AI-Signed Leads
Today marks the official launch of Yaoke Media's AIGC fantasy mystery short drama, "The Secret Story of the Qinling Bronze." Starring the company's first two signed AI actors, Qin Lingyue and Lin Xiyanyan, the story unfolds in the enigmatic Qinling m
Yaoke Media's First AIGC Drama 'The Mystery of the Bronze in Qinling' Launches Today with AI-Signed Leads
Today marks the official launch of Yaoke Media's AIGC fantasy mystery short drama, "The Secret Story of the Qinling Bronze." Starring the company's first two signed AI actors, Qin Lingyue and Lin Xiyanyan, the story unfolds in the enigmatic Qinling m
 Satya Nadella ready to exploit new OpenAI deal
On Wednesday, a Wall Street analyst asked Microsoft CEO Satya Nadella directly how the revised OpenAI partnership would affect the company’s financials.Nadella described the new agreement as a win for everyone. “We feel good about our partnership wit
Satya Nadella ready to exploit new OpenAI deal
On Wednesday, a Wall Street analyst asked Microsoft CEO Satya Nadella directly how the revised OpenAI partnership would affect the company’s financials.Nadella described the new agreement as a win for everyone. “We feel good about our partnership wit
 WordPress.com now allows AI agents to write and publish posts, plus more
WordPress.com, the popular web hosting and publishing platform, is now embracing AI agents—a move that could reshape the look and feel of the web. The company announced Friday that it will allow AI agents to draft, edit, and publish content on custom
WordPress.com now allows AI agents to write and publish posts, plus more
WordPress.com, the popular web hosting and publishing platform, is now embracing AI agents—a move that could reshape the look and feel of the web. The company announced Friday that it will allow AI agents to draft, edit, and publish content on custom

2026 Latest Best AI Expense Trackers: Top-rated tools to scan receipts & categorize corporate spend automatically. Discover powerful, game-changing solutions for effortless expense management, accurate financial tracking, and streamlined compliance. Our curated, weekly-updated comparison of free vs paid options helps you find the perfect fit. Unlock your AI edge with XIX.AI's expert picks.
10 tools
xix.ai

Discover the 2026 latest top-rated AI recruiting tools on XIX.AI. Our curated list features powerful, game-changing solutions for screening resumes and automating candidate interview scheduling. Compare free vs paid options with real-world tests and weekly updated rankings. Find your perfect hiring assistant and streamline your recruitment today!
10 tools
xix.ai

Discover the 2026 best AI personal wellness and focus coaches on XIX.AI. Our curated rankings feature top-rated, game-changing tools to manage burnout and boost mental energy. Compare free vs paid options with real-world insights. Unlock your path to peak productivity and well-being today.
10 tools
xix.ai

Discover the 2026 latest top-rated AI romantic chatbots for building genuine, long-term connections. Our curated list features powerful, consistent personalities, free vs paid comparisons, and real-world tests. Find your perfect companion and start building today at XIX.AI.
10 tools
xix.ai
Discover the 2026 best AI data science mentors to master SQL, Pandas & ML workflows. Explore our top-rated, curated selection at XIX.AI for powerful, game-changing guidance. Compare free vs paid options with real-world insights. Unlock your data science mastery today.
10 tools
xix.ai

Discover the 2026 best AI flirting and conversation trainers on XIX.AI. Our curated, top-rated selection helps you build social charisma and confidence in real-time. Explore must-try, game-changing tools with free vs paid comparisons and weekly updated rankings. Unlock your social edge today.
10 tools
xix.ai

Power BI mit KI? Endlich mal eine Entwicklung, die nicht einfach nur Buzzwords nachplappert. Die Integration sieht durchdacht aus, aber als kleiner Analyst hoffe ich nur, dass mich das Tool nicht irgendwann ersetzt 😅. Hoffentlich bleibt die Benutzeroberfläche trotz der neuen Funktionen übersichtlich.
Power BI의 AI 기능이 진짜 실무에 도움될까요? 저는 막상 사용해보니 평범한 데이터 탐색에는 쓸만하지만, 복잡한 예측 분석에는 아직 한계가 느껴지더라구요... 🙃 그래도 평소 엑셀만 쓰던 팀원들이 쉽게 시각화해보는 계기가 된 건 좋았어요.
Power BI의 AI 기능이 정말 신기하네요! 데이터 분석이 이렇게 쉬워질 줄이야 😲 직장에서 보고서 작성할 때 써보면 엄청 시간 절약될 것 같아요. 근데 AI가 점점 발전하다보면 데이터 분석직종은 어떻게 변하게 될지 궁금해지기도 하네...
Power BI's AI sounds like a data wizard! 🧙♂️ Makes me wonder if it can predict my coffee consumption trends too. Super cool for analysts!
Power BI's AI features sound like a total game-changer! I'm curious how it handles real-time data crunching for small businesses—any cool examples out there? 😎
Power BI's AI features sound like a data nerd's dream! 🚀 I'm curious—how easy is it for a beginner to actually use these tools without getting lost in the tech jungle?