Master Infographic Design in Adobe Illustrator: Step-by-Step Guide
This authoritative guide explores professional techniques for crafting compelling infographics in Adobe Illustrator. As visual storytelling tools that transform complex data into accessible information, infographics serve critical roles in education, marketing, and business reporting. We'll demonstrate essential Illustrator skills including strategic layer organization, typographic best practices, and seamless graphic element integration - empowering you to create polished, informative visualizations that elevate your communication.
Core Design Principles
Mastering layer management in Illustrator for streamlined infographic workflow
Optimizing typography selection and implementation for maximum clarity and visual impact
Techniques for incorporating shapes, icons and illustrations into cohesive designs
Leveraging artboards to systematically organize infographic components
Responsible sourcing and adaptation of clipart with proper copyright considerations
Methods for building custom vector graphics from basic shapes through tracing
Strategic use of color theory and visual hierarchy to guide audience attention
Effectively utilizing pre-made templates to accelerate the design process
Project Setup and Organization
Artboard Configuration and Layer Strategy
Establishing an efficient workspace begins with intelligent artboard implementation - treating each as an independent canvas for specific design phases. This compartmentalized approach maintains clarity during complex projects.
Consider dedicating separate artboards for brainstorming, wireframing, and final composition. Complement this with meticulous layer organization that separates typography, graphical elements, and backgrounds into discrete, logically named layers.
Benefits of this dual organizational system:
- Artboards enable parallel development of different infographic sections
- Layers permit non-destructive editing of individual components
- Clear naming conventions accelerate revision processes
- Isolated elements simplify export preparation
Typography for Information Design
Effective typography transforms static data into compelling narratives. Font selection directly impacts comprehension speed and information retention, demanding careful consideration of both aesthetic and functional requirements.
Key typographic strategies:
- Restrict to two complementary font families for visual harmony
- Establish clear hierarchy through systematic size variation
- Optimize line spacing and letter spacing for improved legibility
- Maintain minimum 4:1 contrast ratio between text and background
- Use weight variants (light, regular, bold) to emphasize key points
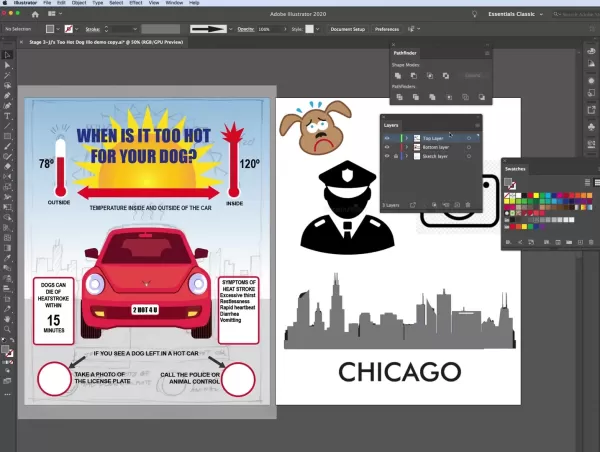
Vector Illustration Techniques
Constructing Characters from Geometric Forms
Illustrator's shape tools enable efficient creation of stylized illustrations perfect for infographics. The process of building a dog character demonstrates universal principles applicable to any subject matter.
Illustrative construction process:
- Establish base proportions using primary ellipse shapes
- Build facial features through scaled secondary shapes
- Create organic elements like ears using the Pen tool
- Refine contours using Pathfinder operations
- Apply color theory principles for visual appeal
This methodology produces infinitely scalable vector assets that maintain crispness at any size while allowing easy future modifications.
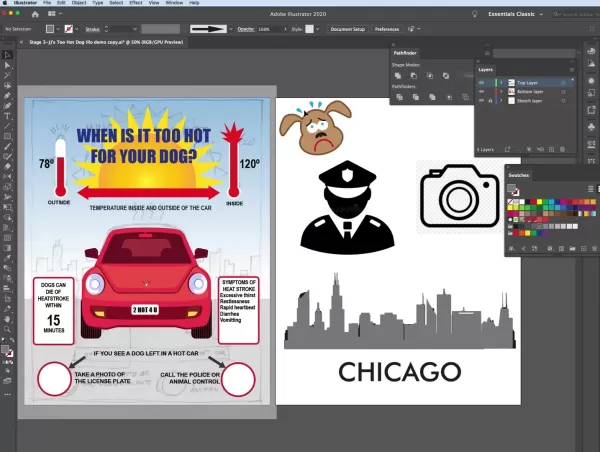
Converting Raster to Vector Assets
The Image Trace function bridges the gap between existing raster graphics and editable vector artwork. This proves invaluable when incorporating clipart while maintaining design flexibility.
Tracing workflow:
- Place high-quality source image (300dpi minimum recommended)
- Experiment with different tracing presets for optimal conversion
- Manually adjust threshold and path complexity for desired fidelity
- Expand tracing to create editable anchor points
- Simplify paths to optimize file performance
This vectorization process transforms static images into flexible design elements that can be recolored, reshaped, and resized without quality loss.
Software Analysis
Strengths
- Industry-standard vector precision and editability
- Sophisticated typographic controls
- Custom illustration creation tools
- Seamless Creative Cloud ecosystem integration
- Resolution-independent output quality
Considerations
- Requires significant time investment to master
- Subscription cost may exceed budget constraints
- Additional tools may be needed for specialized functions
- Performance demands increase with document complexity
- Lacks dedicated infographic-specific features
Common Queries
What organizational methods improve Illustrator efficiency?
Implement a systematic framework using nested layers within logical artboards. Color-code layer groups and establish consistent naming conventions. Utilize Symbols for repetitive elements and Character Styles for text formatting consistency.
How can I enhance infographic readability?
Prioritize information hierarchy through font sizing, implement generous whitespace, use visual cues like arrows to guide the eye, maintain consistent color coding, and simplify complex data into digestible chunks.
What legal considerations exist for clipart usage?
Verify licensing terms before use, prefer Creative Commons or public domain sources when possible, document attribution requirements, and consider purchasing commercial licenses for professional projects. Vector conversion doesn't override copyright restrictions.
Recommended approach for custom graphics?
Start with basic geometric foundations, utilize Pathfinder operations for complex shapes, build with scalability in mind, maintain consistent stroke weights, and organize related elements into grouped layers for easy manipulation.
Advanced Considerations
Selecting Effective Color Schemes
Develop palettes aligned with brand guidelines or subject matter. Use Adobe Color for harmony testing, limit primary colors to maintain cohesion, establish contrast for accessibility, and create tints/shades for visual depth without expanding the palette.
Establishing Visual Hierarchy
Guide viewers through intentional design decisions - size variation establishes importance, color draws attention, proximity indicates relationships, and whitespace creates breathing room. Test hierarchies by squinting to evaluate what elements stand out prominently.
Multi-Platform Optimization
Design at actual size for primary use cases, create alternative layouts for different aspect ratios, optimize typography sizing for mobile readability, export in appropriate file formats (PDF for print, SVG for web), and maintain a master file with all assets for future adaptations.
Related article
 AI Voice Cloning & Deepfake Scams: How to Stay Safe from Fraud
As digital technologies advance, cybercriminals are deploying increasingly sophisticated methods - including AI-powered voice cloning and deepfake technology. Law enforcement agencies warn these tools are being weaponized to create highly personalize
North.Cloud Secures $5M to Revolutionize Cloud FinOps with AI-Driven Operating System
North.Cloud Secures $5 Million Series A to Pioneer Next-Gen Cloud Infrastructure Management
Cloud optimization leader North.Cloud has announced a $5 million Series A funding round led by Companyon Ventures, fueling the rollout of its groundbreaking
Artifism Review: AI-Powered Content & Image Generator SaaS Script
In today's content-driven digital ecosystem, consistently producing high-quality materials presents significant challenges for creators and marketers alike. The Artifism AI Content & Image Generator SaaS script offers an innovative solution by automa
Comments (0)
0/200
AI Voice Cloning & Deepfake Scams: How to Stay Safe from Fraud
As digital technologies advance, cybercriminals are deploying increasingly sophisticated methods - including AI-powered voice cloning and deepfake technology. Law enforcement agencies warn these tools are being weaponized to create highly personalize
North.Cloud Secures $5M to Revolutionize Cloud FinOps with AI-Driven Operating System
North.Cloud Secures $5 Million Series A to Pioneer Next-Gen Cloud Infrastructure Management
Cloud optimization leader North.Cloud has announced a $5 million Series A funding round led by Companyon Ventures, fueling the rollout of its groundbreaking
Artifism Review: AI-Powered Content & Image Generator SaaS Script
In today's content-driven digital ecosystem, consistently producing high-quality materials presents significant challenges for creators and marketers alike. The Artifism AI Content & Image Generator SaaS script offers an innovative solution by automa
Comments (0)
0/200
This authoritative guide explores professional techniques for crafting compelling infographics in Adobe Illustrator. As visual storytelling tools that transform complex data into accessible information, infographics serve critical roles in education, marketing, and business reporting. We'll demonstrate essential Illustrator skills including strategic layer organization, typographic best practices, and seamless graphic element integration - empowering you to create polished, informative visualizations that elevate your communication.
Core Design Principles
Mastering layer management in Illustrator for streamlined infographic workflow
Optimizing typography selection and implementation for maximum clarity and visual impact
Techniques for incorporating shapes, icons and illustrations into cohesive designs
Leveraging artboards to systematically organize infographic components
Responsible sourcing and adaptation of clipart with proper copyright considerations
Methods for building custom vector graphics from basic shapes through tracing
Strategic use of color theory and visual hierarchy to guide audience attention
Effectively utilizing pre-made templates to accelerate the design process
Project Setup and Organization
Artboard Configuration and Layer Strategy
Establishing an efficient workspace begins with intelligent artboard implementation - treating each as an independent canvas for specific design phases. This compartmentalized approach maintains clarity during complex projects.
Consider dedicating separate artboards for brainstorming, wireframing, and final composition. Complement this with meticulous layer organization that separates typography, graphical elements, and backgrounds into discrete, logically named layers.
Benefits of this dual organizational system:
- Artboards enable parallel development of different infographic sections
- Layers permit non-destructive editing of individual components
- Clear naming conventions accelerate revision processes
- Isolated elements simplify export preparation
Typography for Information Design
Effective typography transforms static data into compelling narratives. Font selection directly impacts comprehension speed and information retention, demanding careful consideration of both aesthetic and functional requirements.
Key typographic strategies:
- Restrict to two complementary font families for visual harmony
- Establish clear hierarchy through systematic size variation
- Optimize line spacing and letter spacing for improved legibility
- Maintain minimum 4:1 contrast ratio between text and background
- Use weight variants (light, regular, bold) to emphasize key points
Vector Illustration Techniques
Constructing Characters from Geometric Forms
Illustrator's shape tools enable efficient creation of stylized illustrations perfect for infographics. The process of building a dog character demonstrates universal principles applicable to any subject matter.
Illustrative construction process:
- Establish base proportions using primary ellipse shapes
- Build facial features through scaled secondary shapes
- Create organic elements like ears using the Pen tool
- Refine contours using Pathfinder operations
- Apply color theory principles for visual appeal
This methodology produces infinitely scalable vector assets that maintain crispness at any size while allowing easy future modifications.
Converting Raster to Vector Assets
The Image Trace function bridges the gap between existing raster graphics and editable vector artwork. This proves invaluable when incorporating clipart while maintaining design flexibility.
Tracing workflow:
- Place high-quality source image (300dpi minimum recommended)
- Experiment with different tracing presets for optimal conversion
- Manually adjust threshold and path complexity for desired fidelity
- Expand tracing to create editable anchor points
- Simplify paths to optimize file performance
This vectorization process transforms static images into flexible design elements that can be recolored, reshaped, and resized without quality loss.
Software Analysis
Strengths
- Industry-standard vector precision and editability
- Sophisticated typographic controls
- Custom illustration creation tools
- Seamless Creative Cloud ecosystem integration
- Resolution-independent output quality
Considerations
- Requires significant time investment to master
- Subscription cost may exceed budget constraints
- Additional tools may be needed for specialized functions
- Performance demands increase with document complexity
- Lacks dedicated infographic-specific features
Common Queries
What organizational methods improve Illustrator efficiency?
Implement a systematic framework using nested layers within logical artboards. Color-code layer groups and establish consistent naming conventions. Utilize Symbols for repetitive elements and Character Styles for text formatting consistency.
How can I enhance infographic readability?
Prioritize information hierarchy through font sizing, implement generous whitespace, use visual cues like arrows to guide the eye, maintain consistent color coding, and simplify complex data into digestible chunks.
What legal considerations exist for clipart usage?
Verify licensing terms before use, prefer Creative Commons or public domain sources when possible, document attribution requirements, and consider purchasing commercial licenses for professional projects. Vector conversion doesn't override copyright restrictions.
Recommended approach for custom graphics?
Start with basic geometric foundations, utilize Pathfinder operations for complex shapes, build with scalability in mind, maintain consistent stroke weights, and organize related elements into grouped layers for easy manipulation.
Advanced Considerations
Selecting Effective Color Schemes
Develop palettes aligned with brand guidelines or subject matter. Use Adobe Color for harmony testing, limit primary colors to maintain cohesion, establish contrast for accessibility, and create tints/shades for visual depth without expanding the palette.
Establishing Visual Hierarchy
Guide viewers through intentional design decisions - size variation establishes importance, color draws attention, proximity indicates relationships, and whitespace creates breathing room. Test hierarchies by squinting to evaluate what elements stand out prominently.
Multi-Platform Optimization
Design at actual size for primary use cases, create alternative layouts for different aspect ratios, optimize typography sizing for mobile readability, export in appropriate file formats (PDF for print, SVG for web), and maintain a master file with all assets for future adaptations.


 AI Voice Cloning & Deepfake Scams: How to Stay Safe from Fraud
As digital technologies advance, cybercriminals are deploying increasingly sophisticated methods - including AI-powered voice cloning and deepfake technology. Law enforcement agencies warn these tools are being weaponized to create highly personalize
North.Cloud Secures $5M to Revolutionize Cloud FinOps with AI-Driven Operating System
North.Cloud Secures $5 Million Series A to Pioneer Next-Gen Cloud Infrastructure Management
Cloud optimization leader North.Cloud has announced a $5 million Series A funding round led by Companyon Ventures, fueling the rollout of its groundbreaking
AI Voice Cloning & Deepfake Scams: How to Stay Safe from Fraud
As digital technologies advance, cybercriminals are deploying increasingly sophisticated methods - including AI-powered voice cloning and deepfake technology. Law enforcement agencies warn these tools are being weaponized to create highly personalize
North.Cloud Secures $5M to Revolutionize Cloud FinOps with AI-Driven Operating System
North.Cloud Secures $5 Million Series A to Pioneer Next-Gen Cloud Infrastructure Management
Cloud optimization leader North.Cloud has announced a $5 million Series A funding round led by Companyon Ventures, fueling the rollout of its groundbreaking
 Artifism Review: AI-Powered Content & Image Generator SaaS Script
In today's content-driven digital ecosystem, consistently producing high-quality materials presents significant challenges for creators and marketers alike. The Artifism AI Content & Image Generator SaaS script offers an innovative solution by automa
Artifism Review: AI-Powered Content & Image Generator SaaS Script
In today's content-driven digital ecosystem, consistently producing high-quality materials presents significant challenges for creators and marketers alike. The Artifism AI Content & Image Generator SaaS script offers an innovative solution by automa