AI-Powered Piktograph Guide: Create Stunning Infographics Effortlessly
Infographics have become a go-to method for presenting complex information in a visually engaging way. In the past, crafting these eye-catching visuals required a knack for design and specialized software. But now, thanks to AI-powered tools, anyone can whip up stunning infographics in no time, regardless of their design background. This article dives into how you can use Piktochart, an AI-driven platform, to create captivating infographics with ease.
Key Points
- AI-powered infographic creation means you don't need to be a design whiz.
- Piktochart's user-friendly interface lets you create professional infographics quickly.
- You can generate infographics by simply inputting text or uploading documents.
- The platform offers a variety of customizable templates to fit different content styles.
- Piktochart allows you to tweak colors, fonts, and images to align with your branding.
- Once created, your infographics can be easily downloaded and shared.
Introduction to AI-Powered Infographics
The Rise of AI in Visual Content Creation
Artificial intelligence is transforming how we create content, and visual content is no exception. AI algorithms can sift through data, grasp design principles, and churn out compelling visuals with minimal human effort. This technology levels the playing field, making design accessible to everyone, not just those with dedicated design teams. Tools like Piktochart are leading this charge, enabling users to craft professional infographics without breaking a sweat. By integrating AI, the time and effort needed to produce high-quality visual content are drastically reduced, allowing you to focus on the message you want to convey.
Why Use Piktochart for Infographics?
Piktochart is a versatile web-based graphic design tool tailored for creating infographics, presentations, posters, and more. What makes Piktochart stand out is its AI-powered infographic generator, which streamlines the design process and lets you create professional-looking graphics without any prior experience. Its intuitive interface and extensive template library make it a favorite among marketers, educators, business professionals, and anyone needing to present data visually. Piktochart offers a range of features, from customizable templates to advanced data visualization options, catering to both beginners and seasoned designers. Using Piktochart makes infographic creation more accessible, bridging the gap between complex data and engaging visual communication. With this AI tool, you can quickly and efficiently develop compelling visual narratives that resonate with your audience.
Tips for Creating Effective Infographics
Define Your Objective
Before diving into design, pinpoint the objective of your infographic. What message are you trying to get across? What action do you want your audience to take? A clear objective will steer your design choices and ensure your infographic is focused and impactful.
Know Your Audience
Get to know your target audience and tailor your infographic to their interests and knowledge level. Use language and visuals that speak to them. Consider their demographics, preferences, and needs.
Keep it Simple
Don't overwhelm your audience with too much information. Stick to the most crucial data points and present them clearly and concisely. Use visuals to illustrate key concepts and break up text. Opt for a larger font size where it makes sense.
Use Visuals Effectively
Visuals are the backbone of an infographic. Use charts, graphs, icons, and images to communicate data and ideas in an engaging way. Choose visuals that are relevant to your content and easy to understand. Swap out images with relevant uploads if needed.
Tell a Story
Structure your infographic to tell a story. Start with an introduction, present your main points in a logical sequence, and wrap up with a conclusion or call to action. A compelling narrative will keep your audience engaged and help them remember your message.
Optimize for Sharing
Make it easy for your audience to share your infographic. Include social sharing buttons and optimize your infographic for different platforms. Use a clear and concise title and description. Ensure the colors align with your brand requirements.
Step-by-Step Guide to Creating Infographics with Piktochart AI
Signing Up and Navigating Piktochart
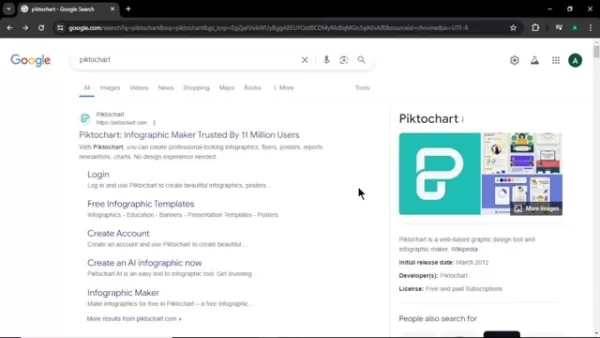
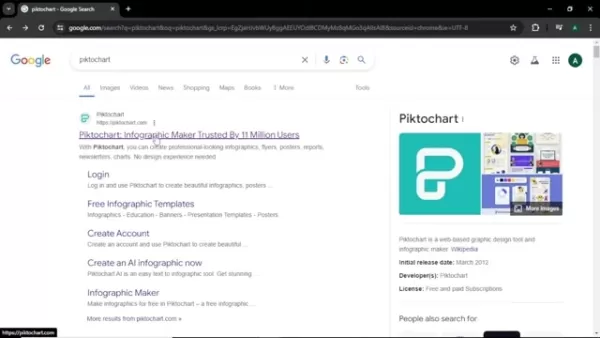
First, head over to the Piktochart website. To start creating your infographic, you'll need to sign up for an account. Click the 'Sign Up' button and choose your preferred method: Facebook, Google, or email. Once registered, you'll land on the Piktochart dashboard, your central hub for accessing various design options and templates. The dashboard is clean and intuitive, making it easy to find what you need. Here, you'll see options like infographics, presentations, posters, reports, and more. Piktochart offers a seamless user experience, ensuring even first-time users can navigate the platform and access its powerful design tools with ease.
Accessing the AI Infographic Generator
From the dashboard, find and click on the 'Infographics' option. This section houses a wide array of infographic templates, catering to different themes and purposes. Look for the 'AI Infographic Generator' section near the top. This is where you'll tap into the power of AI to create your infographic. Clicking the 'Generate AI Infographic' button will take you to the AI-powered creation interface. This step is crucial, as it sets the stage for leveraging AI to simplify and enhance your infographic design process.
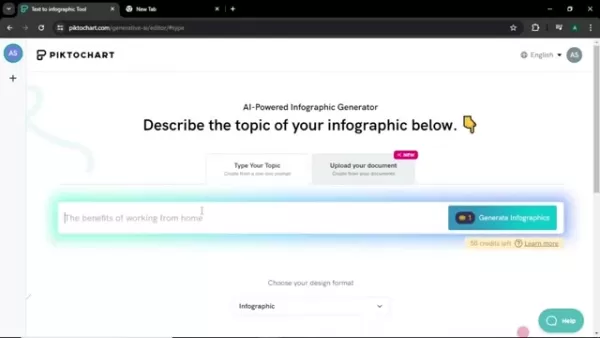
Describing Your Infographic Topic
The AI Infographic Generator needs a text input to understand the type of infographic you want to create. You have two primary methods: typing a text description or uploading a document.
Method 1: Typing a Text Description
In the text input field, describe the topic of your infographic. Be as specific as possible to guide the AI effectively. For example, you might type 'How to be more productive and efficient at work'. The more detailed your description, the better the AI can tailor the infographic to your needs.
Method 2: Uploading a Document
Alternatively, you can upload a document containing the text for your infographic. This method is handy if you already have written content and want the AI to visualize it. Click the 'Upload your document' option and select a PDF, DOCX, or TXT file from your computer. The flexibility of these methods ensures that users can create infographics regardless of the format of their existing content.
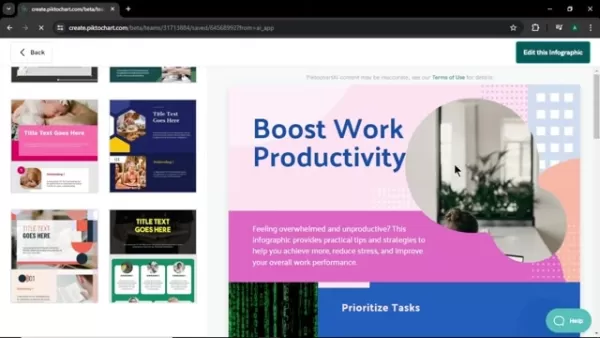
Generating Infographic Designs
After entering your text description or uploading your document, click the 'Generate Infographics' button. The AI will process your input and generate several infographic design options. This process might take a few seconds, depending on the complexity of your content. Once generated, you'll be presented with a variety of templates that align with your topic. The speed and efficiency of this step highlight the power of AI in streamlining content visualization.
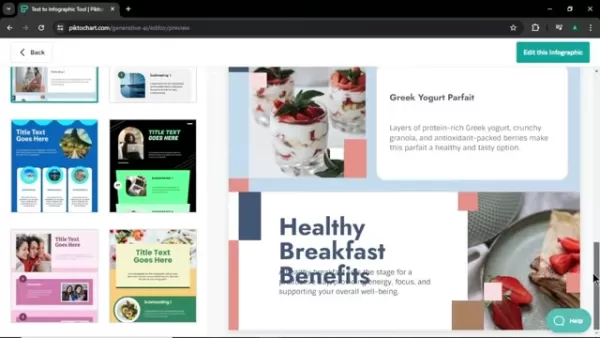
Selecting a Template
Browse through the generated templates and select the one that best fits your content and aesthetic preferences. Piktochart offers a diverse range of designs, each with different layouts, color schemes, and visual elements. Choose a template that's visually appealing and effectively conveys the information you want to present. This step is critical in ensuring your infographic aligns with your brand and messaging, making it both informative and engaging.
Customizing Your Infographic
Once you've selected a template, you can customize it to match your branding and preferences. Piktochart's editor allows you to modify various elements, including:
- Text: Change the font style, size, color, and content of the text elements.
- Images: Replace existing images with your own uploads or choose from Piktochart's library of free images and icons.
- Colors: Adjust the color palette to match your brand guidelines.
- Layout: Rearrange sections and elements to create a layout that effectively presents your information. To adjust the text, double-click the text box; to change the image, click on the image and select 'upload'. Customization is key to creating infographics that are unique and tailored to your specific needs, ensuring your visual content stands out and effectively communicates your message.
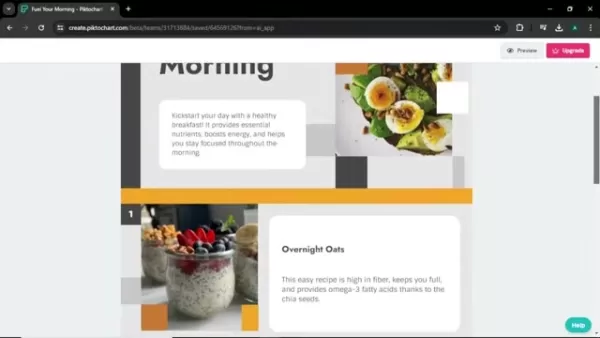
Previewing Your Infographic
Before finalizing your infographic, it's essential to preview it to ensure everything looks perfect. Click the 'Preview' button to see a full-screen version of your design. Review the layout, text, images, and colors to identify any areas that need improvement. Previewing your infographic allows you to catch any errors or inconsistencies before you download and share it, ensuring that your final product is polished and professional.
Downloading and Sharing Your Infographic
Once you're satisfied with your infographic, it's time to download and share it. Click the 'Download' button and choose your preferred file format (PNG, JPG, or PDF) and quality. Piktochart offers different download options to suit various needs, from high-resolution files for printing to optimized files for web use. After downloading, share your infographic on social media, embed it on your website, or include it in your presentations and reports. Effective sharing ensures that your visual content reaches your target audience and achieves its intended impact.
Piktochart Pricing Plans
Overview of Piktochart's Subscription Options
Piktochart offers a range of pricing plans to cater to diverse needs, from individuals to large teams. Understanding these plans is crucial for choosing the right option to meet your infographic creation requirements. Piktochart's pricing is tiered, with each level offering increasing features and benefits. Assessing your needs and comparing them to the plan features ensures you get the most value from your subscription.
Key Features of Each Plan
Here's a summary of Piktochart's key pricing plans:
- Free Plan: The Free plan allows limited access to Piktochart's features, including a limited number of downloads. While it's a great way to explore the platform, the limited resources might not be sufficient for regular users.
- Pro Plan: Offers unlimited visuals, no watermarks, and presentation mode.
- Business Plan: This plan is for large teams, offering all features of Pro, along with advanced collaboration tools, brand kits, and priority support.
Selecting the Right Plan for Your Needs
Choosing the right Piktochart plan depends on several factors, including the frequency of infographic creation, the level of customization required, and the size of your team. Consider the following:
- Individual Users: If you create infographics occasionally and don't need advanced features, the Free plan might suffice. However, consider upgrading to the Pro plan for unlimited access and enhanced customization.
- Small Teams: The Team plan is ideal for small teams that need to collaborate on infographic projects. It offers shared access and team-specific features.
- Large Organizations: Large organizations with complex design requirements should opt for the Enterprise plan, which provides advanced security, dedicated support, and custom integrations.
Pros and Cons of Using Piktochart AI
Pros
- Easy to use with a drag-and-drop interface.
- AI-powered infographic generation saves time and effort.
- Wide variety of customizable templates.
- Affordable pricing plans.
- Great for users without any design experience.
- Ideal for marketers to visually present information and reports.
- Excellent for teaching purposes.
Cons
- The free plan has limited features and downloads.
- Reliance on templates might limit design creativity.
- Requires an internet connection.
- Customization limitations.
Piktochart Core Features
AI-Powered Infographic Generator
Piktochart's core feature is the AI-powered infographic generator that simplifies the design process. With this feature, users can create professional-looking graphics without any prior experience or design skills. Its intuitive interface and extensive template library make it a go-to choice for all types of users.
User-Friendly Interface
Piktochart features an intuitive drag-and-drop interface that makes it easy for anyone to create professional-looking infographics. It includes a wide variety of editing options, such as inserting new photos or changing color palettes.
Piktochart Use Cases
Marketing
For marketing teams, Piktochart offers a compelling solution for presenting complex data in an engaging and digestible format. This allows businesses to communicate their data, sales, and impact reports with customers in a visually appealing way.
Educational Purposes
Teachers can easily illustrate complicated concepts or data that students can interact with. This allows students to retain more information and be more engaged in the classroom. Additionally, students can create their own infographics for assignments.
Business
Business professionals can use Piktochart to generate visually appealing reports that investors or managers can easily understand. By providing digestible visuals, business professionals make their business more efficient.
FAQ
What is Piktochart?
Piktochart is a web-based graphic design tool that allows users to create infographics, presentations, posters, and other visual content with ease. It features an AI-powered infographic generator and a user-friendly drag-and-drop interface.
Do I need design skills to use Piktochart?
No, design skills are not required. Piktochart's AI-powered generator and customizable templates make it easy for anyone to create professional-looking infographics, regardless of their design background.
Can I use my own images and branding elements?
Yes, Piktochart allows you to upload your own images, logos, and branding elements. You can also customize colors, fonts, and layouts to match your brand guidelines.
What file formats can I download my infographics in?
Piktochart allows you to download your infographics in PNG, JPG, and PDF formats. Different plans offer different download options.
Is Piktochart free to use?
Piktochart offers a free plan with limited features and a limited number of downloads. Paid plans provide unlimited access, advanced features, and team collaboration options.
Related Questions
What are the benefits of using infographics?
Infographics offer numerous benefits, including:
- Enhanced Comprehension: Visuals make complex information easier to understand and remember.
- Increased Engagement: Infographics are more engaging than text-heavy content, capturing and holding the audience's attention.
- Improved Memorability: People are more likely to remember information presented visually.
- Wider Reach: Infographics are highly shareable, increasing the reach and visibility of your content.
- Brand Building: Consistent use of branded infographics can help build brand awareness and recognition.
What are some popular infographic design trends?
Popular infographic design trends include:
- Data Visualization: Using charts, graphs, and maps to present data in a visually compelling way.
- Minimalist Design: Emphasizing simplicity and clarity with clean layouts and minimal text.
- Storytelling: Structuring infographics to tell a narrative with a clear beginning, middle, and end.
- Interactive Elements: Incorporating interactive features like animations and clickable elements to enhance engagement.
- Isometric Illustrations: Using 3D illustrations to add depth and visual appeal.
How can I promote my infographics?
You can promote your infographics through various channels, including:
- Social Media: Share your infographic on platforms like Facebook, Twitter, LinkedIn, and Pinterest.
- Website and Blog: Embed your infographic on your website or blog and write a related article.
- Email Marketing: Include your infographic in your email newsletters and campaigns.
- Guest Blogging: Submit your infographic to relevant blogs and websites.
- Press Releases: Distribute a press release announcing your infographic to media outlets.
Related article
 Effortlessly Chat with PDFs Using Gemini API, Langchain, and Chroma DB Integration
Transform your PDF documents into conversational partners with Retrieval-Augmented Generation (RAG) technology. This comprehensive guide demonstrates how to create an intelligent Python system that lets you interact with your PDFs using Gemini API's
Design Eye-Catching Coloring Book Covers Using Leonardo AI
Looking to design eye-catching coloring book covers that grab attention in Amazon's competitive KDP marketplace? Leonardo AI can help you create professional-grade, visually appealing covers that drive sales. Follow our expert techniques to craft stu
YouTube Integrates Veo 3 AI Video Tool Directly Into Shorts Platform
YouTube Shorts to Feature Veo 3 AI Video Model This SummerYouTube CEO Neal Mohan revealed during his Cannes Lions keynote that the platform's cutting-edge Veo 3 AI video generation technology will debut on YouTube Shorts later this summer. This follo
Comments (26)
0/200
Effortlessly Chat with PDFs Using Gemini API, Langchain, and Chroma DB Integration
Transform your PDF documents into conversational partners with Retrieval-Augmented Generation (RAG) technology. This comprehensive guide demonstrates how to create an intelligent Python system that lets you interact with your PDFs using Gemini API's
Design Eye-Catching Coloring Book Covers Using Leonardo AI
Looking to design eye-catching coloring book covers that grab attention in Amazon's competitive KDP marketplace? Leonardo AI can help you create professional-grade, visually appealing covers that drive sales. Follow our expert techniques to craft stu
YouTube Integrates Veo 3 AI Video Tool Directly Into Shorts Platform
YouTube Shorts to Feature Veo 3 AI Video Model This SummerYouTube CEO Neal Mohan revealed during his Cannes Lions keynote that the platform's cutting-edge Veo 3 AI video generation technology will debut on YouTube Shorts later this summer. This follo
Comments (26)
0/200
![StephenMiller]() StephenMiller
StephenMiller
 August 26, 2025 at 11:01:27 PM EDT
This AI infographic tool sounds like a game-changer! I’m no designer, but I can’t wait to try making some slick visuals for my next presentation. 😎


 0
0
![DonaldRoberts]() DonaldRoberts
August 20, 2025 at 3:01:24 PM EDT
DonaldRoberts
August 20, 2025 at 3:01:24 PM EDT
This AI infographic tool sounds like a game-changer! I’m no designer, but I can’t wait to try making some slick visuals for my next presentation. 😎 Anyone else excited to simplify data like this?
0
![SamuelAdams]() SamuelAdams
August 17, 2025 at 9:00:59 AM EDT
SamuelAdams
August 17, 2025 at 9:00:59 AM EDT
Wow, AI making infographics is a game-changer! I used to spend hours tweaking designs, but now it’s like having a pro designer in my pocket. 😎 Super curious to try this tool and see how it stacks up against my old-school methods.
0
![JosephScott]() JosephScott
August 15, 2025 at 5:00:59 PM EDT
JosephScott
August 15, 2025 at 5:00:59 PM EDT
This AI infographic tool sounds like a game-changer! I’ve always struggled with design, so being able to create slick visuals without needing pro skills is awesome. Can’t wait to try it out for my next presentation! 😎
0
![PatrickLewis]() PatrickLewis
August 4, 2025 at 5:00:59 PM EDT
PatrickLewis
August 4, 2025 at 5:00:59 PM EDT
This AI infographic tool sounds like a game-changer! I’m no designer, but I can’t wait to try making some slick visuals for my next presentation. 😎
0
![JustinJohnson]() JustinJohnson
August 4, 2025 at 2:01:00 AM EDT
JustinJohnson
August 4, 2025 at 2:01:00 AM EDT
This AI infographic tool sounds like a game-changer! I’m no designer, but I can’t wait to try making some slick visuals for my next presentation. 😎
0
Infographics have become a go-to method for presenting complex information in a visually engaging way. In the past, crafting these eye-catching visuals required a knack for design and specialized software. But now, thanks to AI-powered tools, anyone can whip up stunning infographics in no time, regardless of their design background. This article dives into how you can use Piktochart, an AI-driven platform, to create captivating infographics with ease.
Key Points
- AI-powered infographic creation means you don't need to be a design whiz.
- Piktochart's user-friendly interface lets you create professional infographics quickly.
- You can generate infographics by simply inputting text or uploading documents.
- The platform offers a variety of customizable templates to fit different content styles.
- Piktochart allows you to tweak colors, fonts, and images to align with your branding.
- Once created, your infographics can be easily downloaded and shared.
Introduction to AI-Powered Infographics
The Rise of AI in Visual Content Creation
Artificial intelligence is transforming how we create content, and visual content is no exception. AI algorithms can sift through data, grasp design principles, and churn out compelling visuals with minimal human effort. This technology levels the playing field, making design accessible to everyone, not just those with dedicated design teams. Tools like Piktochart are leading this charge, enabling users to craft professional infographics without breaking a sweat. By integrating AI, the time and effort needed to produce high-quality visual content are drastically reduced, allowing you to focus on the message you want to convey.
Why Use Piktochart for Infographics?
Piktochart is a versatile web-based graphic design tool tailored for creating infographics, presentations, posters, and more. What makes Piktochart stand out is its AI-powered infographic generator, which streamlines the design process and lets you create professional-looking graphics without any prior experience. Its intuitive interface and extensive template library make it a favorite among marketers, educators, business professionals, and anyone needing to present data visually. Piktochart offers a range of features, from customizable templates to advanced data visualization options, catering to both beginners and seasoned designers. Using Piktochart makes infographic creation more accessible, bridging the gap between complex data and engaging visual communication. With this AI tool, you can quickly and efficiently develop compelling visual narratives that resonate with your audience.
Tips for Creating Effective Infographics
Define Your Objective
Before diving into design, pinpoint the objective of your infographic. What message are you trying to get across? What action do you want your audience to take? A clear objective will steer your design choices and ensure your infographic is focused and impactful.
Know Your Audience
Get to know your target audience and tailor your infographic to their interests and knowledge level. Use language and visuals that speak to them. Consider their demographics, preferences, and needs.
Keep it Simple
Don't overwhelm your audience with too much information. Stick to the most crucial data points and present them clearly and concisely. Use visuals to illustrate key concepts and break up text. Opt for a larger font size where it makes sense.
Use Visuals Effectively
Visuals are the backbone of an infographic. Use charts, graphs, icons, and images to communicate data and ideas in an engaging way. Choose visuals that are relevant to your content and easy to understand. Swap out images with relevant uploads if needed.
Tell a Story
Structure your infographic to tell a story. Start with an introduction, present your main points in a logical sequence, and wrap up with a conclusion or call to action. A compelling narrative will keep your audience engaged and help them remember your message.
Optimize for Sharing
Make it easy for your audience to share your infographic. Include social sharing buttons and optimize your infographic for different platforms. Use a clear and concise title and description. Ensure the colors align with your brand requirements.
Step-by-Step Guide to Creating Infographics with Piktochart AI
Signing Up and Navigating Piktochart
First, head over to the Piktochart website. To start creating your infographic, you'll need to sign up for an account. Click the 'Sign Up' button and choose your preferred method: Facebook, Google, or email. Once registered, you'll land on the Piktochart dashboard, your central hub for accessing various design options and templates. The dashboard is clean and intuitive, making it easy to find what you need. Here, you'll see options like infographics, presentations, posters, reports, and more. Piktochart offers a seamless user experience, ensuring even first-time users can navigate the platform and access its powerful design tools with ease.
Accessing the AI Infographic Generator
From the dashboard, find and click on the 'Infographics' option. This section houses a wide array of infographic templates, catering to different themes and purposes. Look for the 'AI Infographic Generator' section near the top. This is where you'll tap into the power of AI to create your infographic. Clicking the 'Generate AI Infographic' button will take you to the AI-powered creation interface. This step is crucial, as it sets the stage for leveraging AI to simplify and enhance your infographic design process.
Describing Your Infographic Topic
The AI Infographic Generator needs a text input to understand the type of infographic you want to create. You have two primary methods: typing a text description or uploading a document.
Method 1: Typing a Text Description
In the text input field, describe the topic of your infographic. Be as specific as possible to guide the AI effectively. For example, you might type 'How to be more productive and efficient at work'. The more detailed your description, the better the AI can tailor the infographic to your needs.
Method 2: Uploading a Document
Alternatively, you can upload a document containing the text for your infographic. This method is handy if you already have written content and want the AI to visualize it. Click the 'Upload your document' option and select a PDF, DOCX, or TXT file from your computer. The flexibility of these methods ensures that users can create infographics regardless of the format of their existing content.
Generating Infographic Designs
After entering your text description or uploading your document, click the 'Generate Infographics' button. The AI will process your input and generate several infographic design options. This process might take a few seconds, depending on the complexity of your content. Once generated, you'll be presented with a variety of templates that align with your topic. The speed and efficiency of this step highlight the power of AI in streamlining content visualization.
Selecting a Template
Browse through the generated templates and select the one that best fits your content and aesthetic preferences. Piktochart offers a diverse range of designs, each with different layouts, color schemes, and visual elements. Choose a template that's visually appealing and effectively conveys the information you want to present. This step is critical in ensuring your infographic aligns with your brand and messaging, making it both informative and engaging.
Customizing Your Infographic
Once you've selected a template, you can customize it to match your branding and preferences. Piktochart's editor allows you to modify various elements, including:
- Text: Change the font style, size, color, and content of the text elements.
- Images: Replace existing images with your own uploads or choose from Piktochart's library of free images and icons.
- Colors: Adjust the color palette to match your brand guidelines.
- Layout: Rearrange sections and elements to create a layout that effectively presents your information. To adjust the text, double-click the text box; to change the image, click on the image and select 'upload'. Customization is key to creating infographics that are unique and tailored to your specific needs, ensuring your visual content stands out and effectively communicates your message.
Previewing Your Infographic
Before finalizing your infographic, it's essential to preview it to ensure everything looks perfect. Click the 'Preview' button to see a full-screen version of your design. Review the layout, text, images, and colors to identify any areas that need improvement. Previewing your infographic allows you to catch any errors or inconsistencies before you download and share it, ensuring that your final product is polished and professional.
Downloading and Sharing Your Infographic
Once you're satisfied with your infographic, it's time to download and share it. Click the 'Download' button and choose your preferred file format (PNG, JPG, or PDF) and quality. Piktochart offers different download options to suit various needs, from high-resolution files for printing to optimized files for web use. After downloading, share your infographic on social media, embed it on your website, or include it in your presentations and reports. Effective sharing ensures that your visual content reaches your target audience and achieves its intended impact.
Piktochart Pricing Plans
Overview of Piktochart's Subscription Options
Piktochart offers a range of pricing plans to cater to diverse needs, from individuals to large teams. Understanding these plans is crucial for choosing the right option to meet your infographic creation requirements. Piktochart's pricing is tiered, with each level offering increasing features and benefits. Assessing your needs and comparing them to the plan features ensures you get the most value from your subscription.
Key Features of Each Plan
Here's a summary of Piktochart's key pricing plans:
- Free Plan: The Free plan allows limited access to Piktochart's features, including a limited number of downloads. While it's a great way to explore the platform, the limited resources might not be sufficient for regular users.
- Pro Plan: Offers unlimited visuals, no watermarks, and presentation mode.
- Business Plan: This plan is for large teams, offering all features of Pro, along with advanced collaboration tools, brand kits, and priority support.
Selecting the Right Plan for Your Needs
Choosing the right Piktochart plan depends on several factors, including the frequency of infographic creation, the level of customization required, and the size of your team. Consider the following:
- Individual Users: If you create infographics occasionally and don't need advanced features, the Free plan might suffice. However, consider upgrading to the Pro plan for unlimited access and enhanced customization.
- Small Teams: The Team plan is ideal for small teams that need to collaborate on infographic projects. It offers shared access and team-specific features.
- Large Organizations: Large organizations with complex design requirements should opt for the Enterprise plan, which provides advanced security, dedicated support, and custom integrations.
Pros and Cons of Using Piktochart AI
Pros
- Easy to use with a drag-and-drop interface.
- AI-powered infographic generation saves time and effort.
- Wide variety of customizable templates.
- Affordable pricing plans.
- Great for users without any design experience.
- Ideal for marketers to visually present information and reports.
- Excellent for teaching purposes.
Cons
- The free plan has limited features and downloads.
- Reliance on templates might limit design creativity.
- Requires an internet connection.
- Customization limitations.
Piktochart Core Features
AI-Powered Infographic Generator
Piktochart's core feature is the AI-powered infographic generator that simplifies the design process. With this feature, users can create professional-looking graphics without any prior experience or design skills. Its intuitive interface and extensive template library make it a go-to choice for all types of users.
User-Friendly Interface
Piktochart features an intuitive drag-and-drop interface that makes it easy for anyone to create professional-looking infographics. It includes a wide variety of editing options, such as inserting new photos or changing color palettes.
Piktochart Use Cases
Marketing
For marketing teams, Piktochart offers a compelling solution for presenting complex data in an engaging and digestible format. This allows businesses to communicate their data, sales, and impact reports with customers in a visually appealing way.
Educational Purposes
Teachers can easily illustrate complicated concepts or data that students can interact with. This allows students to retain more information and be more engaged in the classroom. Additionally, students can create their own infographics for assignments.
Business
Business professionals can use Piktochart to generate visually appealing reports that investors or managers can easily understand. By providing digestible visuals, business professionals make their business more efficient.
FAQ
What is Piktochart?
Piktochart is a web-based graphic design tool that allows users to create infographics, presentations, posters, and other visual content with ease. It features an AI-powered infographic generator and a user-friendly drag-and-drop interface.
Do I need design skills to use Piktochart?
No, design skills are not required. Piktochart's AI-powered generator and customizable templates make it easy for anyone to create professional-looking infographics, regardless of their design background.
Can I use my own images and branding elements?
Yes, Piktochart allows you to upload your own images, logos, and branding elements. You can also customize colors, fonts, and layouts to match your brand guidelines.
What file formats can I download my infographics in?
Piktochart allows you to download your infographics in PNG, JPG, and PDF formats. Different plans offer different download options.
Is Piktochart free to use?
Piktochart offers a free plan with limited features and a limited number of downloads. Paid plans provide unlimited access, advanced features, and team collaboration options.
Related Questions
What are the benefits of using infographics?
Infographics offer numerous benefits, including:
- Enhanced Comprehension: Visuals make complex information easier to understand and remember.
- Increased Engagement: Infographics are more engaging than text-heavy content, capturing and holding the audience's attention.
- Improved Memorability: People are more likely to remember information presented visually.
- Wider Reach: Infographics are highly shareable, increasing the reach and visibility of your content.
- Brand Building: Consistent use of branded infographics can help build brand awareness and recognition.
What are some popular infographic design trends?
Popular infographic design trends include:
- Data Visualization: Using charts, graphs, and maps to present data in a visually compelling way.
- Minimalist Design: Emphasizing simplicity and clarity with clean layouts and minimal text.
- Storytelling: Structuring infographics to tell a narrative with a clear beginning, middle, and end.
- Interactive Elements: Incorporating interactive features like animations and clickable elements to enhance engagement.
- Isometric Illustrations: Using 3D illustrations to add depth and visual appeal.
How can I promote my infographics?
You can promote your infographics through various channels, including:
- Social Media: Share your infographic on platforms like Facebook, Twitter, LinkedIn, and Pinterest.
- Website and Blog: Embed your infographic on your website or blog and write a related article.
- Email Marketing: Include your infographic in your email newsletters and campaigns.
- Guest Blogging: Submit your infographic to relevant blogs and websites.
- Press Releases: Distribute a press release announcing your infographic to media outlets.


 Effortlessly Chat with PDFs Using Gemini API, Langchain, and Chroma DB Integration
Transform your PDF documents into conversational partners with Retrieval-Augmented Generation (RAG) technology. This comprehensive guide demonstrates how to create an intelligent Python system that lets you interact with your PDFs using Gemini API's
Effortlessly Chat with PDFs Using Gemini API, Langchain, and Chroma DB Integration
Transform your PDF documents into conversational partners with Retrieval-Augmented Generation (RAG) technology. This comprehensive guide demonstrates how to create an intelligent Python system that lets you interact with your PDFs using Gemini API's
 Design Eye-Catching Coloring Book Covers Using Leonardo AI
Looking to design eye-catching coloring book covers that grab attention in Amazon's competitive KDP marketplace? Leonardo AI can help you create professional-grade, visually appealing covers that drive sales. Follow our expert techniques to craft stu
Design Eye-Catching Coloring Book Covers Using Leonardo AI
Looking to design eye-catching coloring book covers that grab attention in Amazon's competitive KDP marketplace? Leonardo AI can help you create professional-grade, visually appealing covers that drive sales. Follow our expert techniques to craft stu
 YouTube Integrates Veo 3 AI Video Tool Directly Into Shorts Platform
YouTube Shorts to Feature Veo 3 AI Video Model This SummerYouTube CEO Neal Mohan revealed during his Cannes Lions keynote that the platform's cutting-edge Veo 3 AI video generation technology will debut on YouTube Shorts later this summer. This follo
August 26, 2025 at 11:01:27 PM EDT
YouTube Integrates Veo 3 AI Video Tool Directly Into Shorts Platform
YouTube Shorts to Feature Veo 3 AI Video Model This SummerYouTube CEO Neal Mohan revealed during his Cannes Lions keynote that the platform's cutting-edge Veo 3 AI video generation technology will debut on YouTube Shorts later this summer. This follo
August 26, 2025 at 11:01:27 PM EDT
This AI infographic tool sounds like a game-changer! I’m no designer, but I can’t wait to try making some slick visuals for my next presentation. 😎
0
August 20, 2025 at 3:01:24 PM EDT
This AI infographic tool sounds like a game-changer! I’m no designer, but I can’t wait to try making some slick visuals for my next presentation. 😎 Anyone else excited to simplify data like this?
0
August 17, 2025 at 9:00:59 AM EDT
Wow, AI making infographics is a game-changer! I used to spend hours tweaking designs, but now it’s like having a pro designer in my pocket. 😎 Super curious to try this tool and see how it stacks up against my old-school methods.
0
August 15, 2025 at 5:00:59 PM EDT
This AI infographic tool sounds like a game-changer! I’ve always struggled with design, so being able to create slick visuals without needing pro skills is awesome. Can’t wait to try it out for my next presentation! 😎
0
August 4, 2025 at 5:00:59 PM EDT
This AI infographic tool sounds like a game-changer! I’m no designer, but I can’t wait to try making some slick visuals for my next presentation. 😎
0
August 4, 2025 at 2:01:00 AM EDT
This AI infographic tool sounds like a game-changer! I’m no designer, but I can’t wait to try making some slick visuals for my next presentation. 😎
0