Home
HomeAI-Powered Guide: Create Stunning Timeline Infographics in Simple Steps
In today's fast-paced world, it's essential to communicate information quickly and effectively. One of the best ways to do this is through timeline infographics, which offer a visually engaging and easy-to-digest way to present data. Thanks to advancements in AI, creating these infographics has never been easier. This article will walk you through the process of crafting stunning timeline infographics using Skills.ai, an AI-powered platform that turns your data into captivating visuals. Whether you're in marketing, education, or business, this guide will help you master the art of creating infographics that grab your audience's attention.
Key Points
- Learn how AI streamlines the creation of infographics.
- Explore how to use Skills.ai to easily generate timeline infographics.
- Understand the process of inputting data and letting AI extract key events.
- Customize your infographic with a variety of themes and styles.
- Discover the advantages of AI-powered infographic creation across different fields.
Introduction to AI-Powered Infographic Creation
The Power of Visual Data Representation
Our brains process visuals much faster than text, which is why infographics are such a powerful tool for conveying complex information. A well-crafted timeline infographic can beautifully illustrate historical events, project milestones, or process flows, providing your audience with clarity and context. With AI, you can create professional-quality infographics without needing extensive design skills. This technology saves time, reduces costs, and enhances communication. Platforms like Skills.ai, with their automatic data extraction and suggested layouts, are changing the game in how we create and consume visual data.
Timeline infographics are particularly effective for:
- Historical overviews: Showcasing key moments in a company's history or the development of a technology.
- Project planning: Outlining milestones and deadlines for projects.
- Process visualization: Detailing the steps in a process, like product development stages or the customer journey.
- Educational materials: Presenting historical timelines or scientific concepts in a visually appealing way.
Using AI-powered tools to create these infographics not only makes them more effective but also offers customized visuals and enhanced readability.
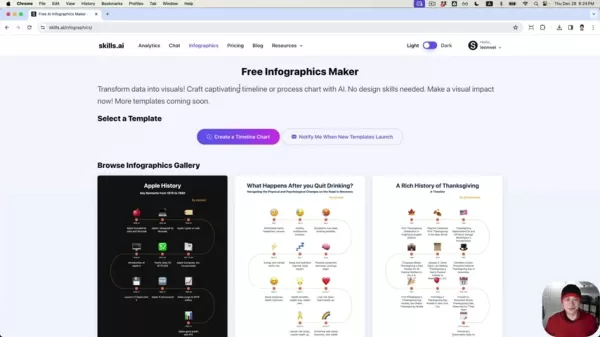
Skills.ai: Your AI Infographic Creation Partner
Skills.ai is a platform that transforms data into visuals, helping you craft captivating timelines and process charts with the power of AI. It's designed to make visual communication accessible to everyone, regardless of their design expertise. Skills.ai boasts a user-friendly interface, intelligent data extraction, and customizable templates, offering several key advantages:
- Ease of Use: A simple drag-and-drop interface, clear instructions, and a minimal learning curve.
- AI-Powered Data Extraction: Automatically extracts key events and dates from raw text, saving you time and effort.
- Customizable Templates: A variety of templates that can be tailored to your specific needs and branding.
- Versatility: Supports the creation of various types of infographics, including timelines, process flows, and comparison charts.
- Professional Quality: Produces high-resolution infographics suitable for both online and offline use.
Skills.ai simplifies the complex process of infographic design, making it the go-to solution for anyone looking to quickly create impactful visuals. By merging AI technology with intuitive design features, Skills.ai helps you tell your stories through visually compelling infographics.
A Detailed Walkthrough: Creating an Apple History Timeline Infographic with Skills.ai
Step 1: Preparing Your Data
Before you start creating your infographic, you need to gather the data that will form its backbone. This includes key events, dates, and brief descriptions of each event. You can collect this data from historical records, company reports, or research papers. Skills.ai offers the option to manually enter your data or use its intelligent data extraction feature for quicker results.
If you have structured data, you can copy and paste it into Skills.ai's online spreadsheet. Make sure your data is organized with columns for time, event, and emoji. If you're working with raw text, Skills.ai's AI-powered event extraction feature can help identify key events. Clean and verify your data before inputting it to ensure accuracy and relevance. Organizing your data beforehand can save time and prevent errors.
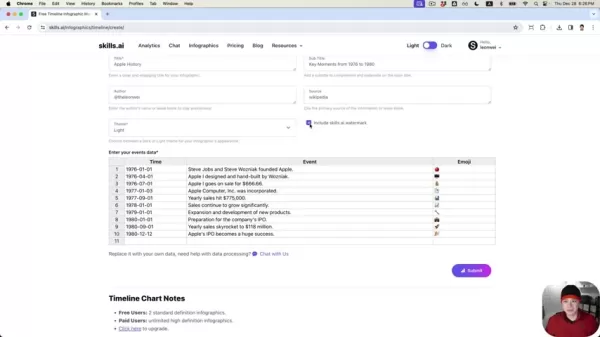
For this walkthrough, we'll create a timeline infographic of Apple's history from its founding to its IPO. We'll include key events like the company's founding date, the release of its first products, and significant milestones in its early years. The data for this timeline is sourced from Wikipedia.
Step 2: Utilizing AI for Data Population
Skills.ai provides two methods for populating data into your timeline infographic: manual entry and AI-powered data extraction. For manual entry, you input the dates, events, and emojis into the designated fields on the Skills.ai platform. This method gives you complete control over the content and allows for fine-tuning of each entry.
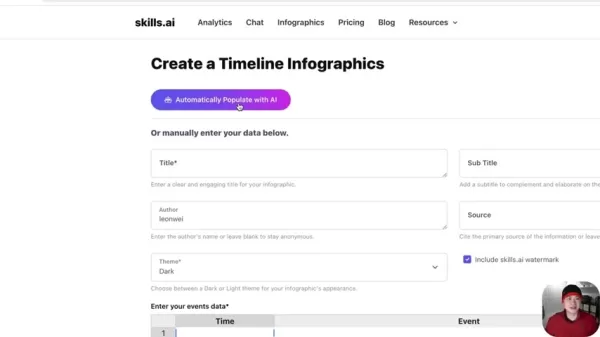
For a more efficient approach, use the AI-powered event extraction feature. Input your raw text, and Skills.ai's AI algorithms will identify key events and dates, populating the corresponding fields. Click on the 'Automatically Populate with AI' button, paste your text into the provided box, and submit it for processing. After processing, review the extracted data in the online spreadsheet and make any necessary adjustments for accuracy and clarity.
This AI functionality is particularly useful for extracting data from lengthy articles, historical documents, or company reports, saving you significant time and effort. Ensure your raw text contains clear and concise descriptions of each event to maximize the accuracy of the AI extraction. For our Apple history timeline, we'll use this feature to populate the timeline with key milestones from Apple's early years.
Step 3: Customizing Your Infographic's Appearance
With your data populated, it's time to customize your infographic's appearance to match your branding and aesthetic preferences. Skills.ai offers a range of options, including theme selection, font choices, color palettes, and image integration.

Start by selecting a title and subtitle that accurately represent your infographic's content. Skills.ai often generates these automatically based on your input data, but you can modify them to better capture the essence of your timeline.
You can choose between a light or dark theme, depending on your preferences and the overall tone of your infographic. Skills.ai offers several default color palettes, but you can also create your own custom color palette to match your branding guidelines. Ensure the colors you choose are visually appealing and enhance readability. Customize author and source information, adding your Twitter handle if desired.
Consider adding relevant images or icons to enhance the visual appeal of your infographic. Skills.ai provides a library of free icons, or you can upload your own custom images. Select images that are relevant to the events in your timeline and contribute to the overall message of your infographic. Through these customization options, Skills.ai empowers you to create a visually compelling infographic that effectively communicates your message to your target audience.
Step 4: Reviewing and Submitting Your Timeline Infographic
Before finalizing your timeline infographic, take the time to carefully review all the data, customizations, and visual elements. Verify that all dates, events, and descriptions are accurate and consistent. Ensure the timeline flows smoothly and is easy to follow. Proofread for any spelling or grammatical errors. Once satisfied with the accuracy and clarity, submit your infographic for generation.
Skills.ai will process your data and customizations to create the final version of your timeline infographic. The generated infographic will be in a high-resolution format suitable for both online and offline use. Download your infographic in various formats like JPEG, PNG, or SVG, depending on your needs. Share your infographic on social media, embed it on your website, or include it in your presentations. By following these steps, you can create a professional-quality timeline infographic that effectively communicates your message and engages your audience.
Step-by-Step Guide: Creating Timeline Infographics with Skills.ai
Step 1: Access Skills.ai and Select a Template
Start by navigating to the Skills.ai website. Once there, you can browse the available templates or begin from scratch. Skills.ai offers various templates designed for different types of infographics, including timelines, process flows, and comparison charts. Choose a timeline template that suits your needs and branding.
If you prefer to start from scratch, select a blank canvas and manually add all the elements to your infographic. For this guide, we'll use a timeline template to streamline the creation process. Review the available templates and choose one that aligns with your design aesthetic and data presentation needs.
Step 2: Data Input Methods
There are two ways to input data into your Skills.ai timeline: manually or through AI. If you have structured data, copy and paste it into the online spreadsheet provided by Skills.ai.
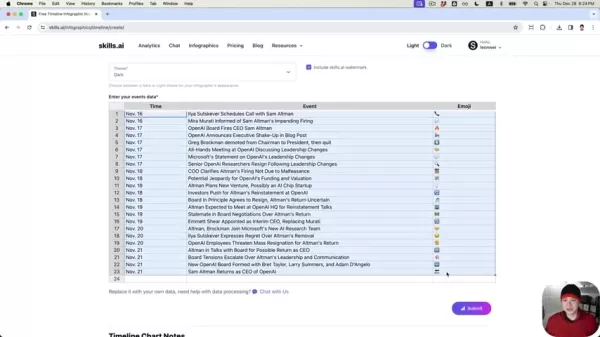
Ensure your data is organized with columns for time, event, and emoji. If you have raw text containing the information, use the AI-powered event extraction feature. This function allows Skills.ai's AI algorithms to automatically detect key events and dates, populating the corresponding fields. Click the 'Automatically Populate with AI' button and paste your text into the provided box.
Step 3: Customization Options
Once your data is uploaded, Skills.ai offers numerous customization options to refine your infographic's look and feel.
Begin by adjusting the title and subtitle to better reflect the data. You can tweak the overall theme to match your brand's aesthetic, choosing between light and dark themes. If you're a paid subscriber, you can remove the Skills.ai watermark. Modify individual emojis to ensure they accurately represent each event, enhancing the visual narrative.
Step 4: Submitting and Sharing Your Infographic
Once you're happy with your timeline infographic's data, customizations, and visuals, submit it for generation. Skills.ai will process your inputs and create the final version in a high-resolution format. Download your infographic in formats like JPEG, PNG, or SVG, depending on your needs. Share your infographic on social media, embed it on your website, or include it in your presentations. Use the share button on Skills.ai to leverage its features.
Skills.ai Pricing
Subscription Tiers and Features
Skills.ai offers different subscription tiers to meet varying user needs. The free tier provides access to a limited number of templates and features, while paid tiers unlock additional templates, advanced customization options, and priority support. Free users can create two standard definition infographics per month, while paid users can upgrade to higher quality output. Check the Skills.ai pricing page for the latest information on subscription tiers, features, and pricing details.
Evaluate your infographic creation needs and choose the subscription tier that best fits your requirements. The free tier might be sufficient if you only need to create a few basic infographics per month. However, if you need access to advanced features and priority support, consider upgrading to a paid tier.
Regardless of your chosen tier, Skills.ai provides a valuable tool for transforming data into visually compelling infographics.
Pros and Cons of Using Skills.ai
Pros
- User-friendly interface
- AI-powered data extraction
- Customizable templates
- Versatile infographic creation
- Professional-quality output
Cons
- Limited features in the free tier
- May require a paid subscription for advanced customization
- AI data extraction may not be perfect and may require manual adjustments
Skills.ai Core Features
Key Functionalities for Infographic Creation
Skills.ai offers a comprehensive suite of features designed to simplify and enhance the infographic creation process. These include:
- AI-Powered Data Extraction: Automatically extracts key events and dates from raw text.
- Customizable Templates: Offers a variety of templates that can be tailored to your specific needs and branding.
- Drag-and-Drop Interface: Provides a user-friendly interface for easy infographic creation.
- Theme Selection: Allows you to choose between a light or dark theme for your infographic.
- Color Palette Customization: Enables you to create custom color palettes to match your branding guidelines.
- Image Integration: Supports the integration of relevant images or icons to enhance visual appeal.
- High-Resolution Output: Generates high-resolution infographics suitable for both online and offline use.
- Multiple Download Formats: Allows you to download your infographic in various formats, such as JPEG, PNG, or SVG.
By combining these features, Skills.ai empowers users to create professional-quality infographics without needing extensive design skills. Use the AI-powered data extraction feature to save time and effort. Choose a template that aligns with your specific needs and branding. Leverage the drag-and-drop interface to easily add and arrange elements. Customize the theme and color palette to match your brand guidelines. Integrate relevant images or icons to enhance visual appeal. With Skills.ai, the possibilities are endless.
Skills.ai Use Cases
Applications Across Industries
Skills.ai's versatility makes it applicable across a wide range of industries and use cases. Here are a few examples:
- Marketing: Create engaging infographics to promote products, services, or events.
- Education: Develop visually appealing learning materials for students of all ages.
- Business: Communicate complex data and insights to colleagues and clients.
- Journalism: Present news and information in a concise and visually appealing format.
- Nonprofits: Raise awareness for important causes and initiatives.
In marketing, Skills.ai can help create eye-catching infographics that highlight product features, showcase customer testimonials, or illustrate market trends. In education, it can be used to develop interactive learning modules, present historical timelines, or explain scientific concepts. In business, Skills.ai can create data-driven presentations, visualize project timelines, or communicate company performance metrics. Consider how Skills.ai can improve communication and engagement within your specific industry and organization.
FAQ
Can I use Skills.ai for free?
Yes, Skills.ai offers a free tier with limited features. You can create a limited number of infographics per month and access a selection of basic templates. To unlock additional templates, advanced customization options, and priority support, you'll need to upgrade to a paid subscription.
Do I need design skills to use Skills.ai?
No, Skills.ai is designed to be user-friendly and accessible to everyone, regardless of their design expertise. The platform offers a drag-and-drop interface, customizable templates, and AI-powered data extraction, making it easy to create professional-quality infographics without any prior design experience.
What file formats are supported for downloading infographics?
Skills.ai allows you to download your infographics in various formats, including JPEG, PNG, and SVG. This provides flexibility for using your infographics across different platforms and applications.
Can I customize the color palette of my infographics?
Yes, Skills.ai allows you to create custom color palettes to match your branding guidelines. This ensures that your infographics are visually consistent with your other marketing materials and brand identity.
Is there customer support available for Skills.ai?
Yes, Skills.ai offers customer support to assist you with any questions or issues you may encounter. Paid subscribers receive priority support, ensuring timely and effective resolution of their inquiries.
Related Questions
What are the best practices for designing effective infographics?
Designing effective infographics involves several key considerations. First, define your target audience and tailor your infographic's content and style to their interests and needs. Second, focus on clarity and conciseness, using visuals and text sparingly to communicate your message effectively. Third, choose a visually appealing layout that is easy to follow and guides the viewer's eye through the information. Fourth, use a consistent color palette and typography to maintain a professional and cohesive look. Finally, cite your sources to ensure credibility and avoid plagiarism.
Additional tips for designing effective infographics include:
- Use high-quality visuals: Images and icons should be clear, relevant, and visually appealing.
- Keep it simple: Avoid overwhelming the viewer with too much information.
- Tell a story: Structure your infographic to tell a compelling story that engages the viewer.
- Optimize for sharing: Make it easy for others to share your infographic on social media and other platforms.
- Test and iterate: Get feedback on your infographic and make revisions as needed to improve its effectiveness.
Related article
 Musk’s Grok: 1.5 Trillion Parameters and Cursor Code Absorption—Game Changer or Bluff?
Elon Musk is finally making a move.In the AI programming race, OpenAI and Anthropic are accelerating, while xAI appears to be lagging. Musk has often stated his aim to rival Claude, yet despite multiple updates to the Grok4.X series, the results look
OpenAI Secretly Changes Charter to Make Removing Altman Harder
Following the 2023 coup-like incident, OpenAI has further solidified protections for CEO Sam Altman by updating its corporate bylaws. Recently released court documents reveal that Altman's position is now rock-solid, with substantially higher barrier
Meta AI now responds to buyer messages on Facebook Marketplace
Facebook Marketplace introduces new Meta AI features, including automated replies to buyer inquiries, the company announced Thursday. The platform also leverages AI to accelerate item listings, summarize seller profiles, and now lets sellers offer sh
Related Special Topic Recommendations
Business
Musk’s Grok: 1.5 Trillion Parameters and Cursor Code Absorption—Game Changer or Bluff?
Elon Musk is finally making a move.In the AI programming race, OpenAI and Anthropic are accelerating, while xAI appears to be lagging. Musk has often stated his aim to rival Claude, yet despite multiple updates to the Grok4.X series, the results look
OpenAI Secretly Changes Charter to Make Removing Altman Harder
Following the 2023 coup-like incident, OpenAI has further solidified protections for CEO Sam Altman by updating its corporate bylaws. Recently released court documents reveal that Altman's position is now rock-solid, with substantially higher barrier
Meta AI now responds to buyer messages on Facebook Marketplace
Facebook Marketplace introduces new Meta AI features, including automated replies to buyer inquiries, the company announced Thursday. The platform also leverages AI to accelerate item listings, summarize seller profiles, and now lets sellers offer sh
Related Special Topic Recommendations
Business
 Best AI Recruiting Tools: Screen Resumes & Automate Candidate Interview Scheduling
Discover the 2026 latest top-rated AI recruiting tools on XIX.AI. Our curated list features powerful, game-changing solutions for screening resumes and automating candidate interview scheduling. Compare free vs paid options with real-world tests and weekly updated rankings. Find your perfect hiring assistant and streamline your recruitment today!
 10 tools
 xix.ai
Productivity
AI Personal Wellness & Focus Coaches: Manage Burnout & Boost Mental Energy Levels
xix.ai
Productivity
AI Personal Wellness & Focus Coaches: Manage Burnout & Boost Mental Energy Levels
Discover the 2026 best AI personal wellness and focus coaches on XIX.AI. Our curated rankings feature top-rated, game-changing tools to manage burnout and boost mental energy. Compare free vs paid options with real-world insights. Unlock your path to peak productivity and well-being today.
10 tools
xix.ai
chatbot
Top-Rated AI Romantic Chatbots: Build Long-Term Relationships with Consistent Personalities
Discover the 2026 latest top-rated AI romantic chatbots for building genuine, long-term connections. Our curated list features powerful, consistent personalities, free vs paid comparisons, and real-world tests. Find your perfect companion and start building today at XIX.AI.
10 tools
xix.ai
Education and Learning
Best AI Data Science Mentors: Master SQL, Pandas & Machine Learning Workflows
Discover the 2026 best AI data science mentors to master SQL, Pandas & ML workflows. Explore our top-rated, curated selection at XIX.AI for powerful, game-changing guidance. Compare free vs paid options with real-world insights. Unlock your data science mastery today.
10 tools
xix.ai
chatbot
Best AI Flirting & Conversation Trainers: Improve Social Charisma and Confidence in Real-Time
Discover the 2026 best AI flirting and conversation trainers on XIX.AI. Our curated, top-rated selection helps you build social charisma and confidence in real-time. Explore must-try, game-changing tools with free vs paid comparisons and weekly updated rankings. Unlock your social edge today.
10 tools
xix.ai
code
Best AI Tools for Automated Unit Testing: Generate Jest, PyTest & JUnit Test Cases in One Click
Discover the 2026 latest top-rated AI tools for automated unit testing. Our curated selection features powerful, game-changing solutions to generate Jest, PyTest & JUnit test cases instantly. Compare free vs paid options with real-world tests and weekly updated rankings on XIX.AI. Unlock your AI edge and boost development productivity today.
10 tools
xix.ai

 Comments (4)
0/500
Comments (4)
0/500
![JonathanDavis]()
This AI infographic tool sounds like a game-changer! I’m no designer, but I can see myself whipping up sleek timelines for my presentations. Excited to try it out! 😎
![WalterNelson]()
This AI-powered infographic guide is a game-changer! I love how it simplifies complex data into something visually awesome. Can't wait to try it for my next presentation! 😍
![RyanSmith]()
Super cool guide! AI making infographics so easy is a game-changer. Tried it and my timeline looks pro! 😎
![RyanGonzalez]()
This AI-powered guide for timeline infographics is a game-changer! 😍 I love how it simplifies complex data into something visually awesome. Can’t wait to try it for my next presentation!
In today's fast-paced world, it's essential to communicate information quickly and effectively. One of the best ways to do this is through timeline infographics, which offer a visually engaging and easy-to-digest way to present data. Thanks to advancements in AI, creating these infographics has never been easier. This article will walk you through the process of crafting stunning timeline infographics using Skills.ai, an AI-powered platform that turns your data into captivating visuals. Whether you're in marketing, education, or business, this guide will help you master the art of creating infographics that grab your audience's attention.
Key Points
- Learn how AI streamlines the creation of infographics.
- Explore how to use Skills.ai to easily generate timeline infographics.
- Understand the process of inputting data and letting AI extract key events.
- Customize your infographic with a variety of themes and styles.
- Discover the advantages of AI-powered infographic creation across different fields.
Introduction to AI-Powered Infographic Creation
The Power of Visual Data Representation
Our brains process visuals much faster than text, which is why infographics are such a powerful tool for conveying complex information. A well-crafted timeline infographic can beautifully illustrate historical events, project milestones, or process flows, providing your audience with clarity and context. With AI, you can create professional-quality infographics without needing extensive design skills. This technology saves time, reduces costs, and enhances communication. Platforms like Skills.ai, with their automatic data extraction and suggested layouts, are changing the game in how we create and consume visual data.
Timeline infographics are particularly effective for:
- Historical overviews: Showcasing key moments in a company's history or the development of a technology.
- Project planning: Outlining milestones and deadlines for projects.
- Process visualization: Detailing the steps in a process, like product development stages or the customer journey.
- Educational materials: Presenting historical timelines or scientific concepts in a visually appealing way.
Using AI-powered tools to create these infographics not only makes them more effective but also offers customized visuals and enhanced readability.
Skills.ai: Your AI Infographic Creation Partner
Skills.ai is a platform that transforms data into visuals, helping you craft captivating timelines and process charts with the power of AI. It's designed to make visual communication accessible to everyone, regardless of their design expertise. Skills.ai boasts a user-friendly interface, intelligent data extraction, and customizable templates, offering several key advantages:
- Ease of Use: A simple drag-and-drop interface, clear instructions, and a minimal learning curve.
- AI-Powered Data Extraction: Automatically extracts key events and dates from raw text, saving you time and effort.
- Customizable Templates: A variety of templates that can be tailored to your specific needs and branding.
- Versatility: Supports the creation of various types of infographics, including timelines, process flows, and comparison charts.
- Professional Quality: Produces high-resolution infographics suitable for both online and offline use.
Skills.ai simplifies the complex process of infographic design, making it the go-to solution for anyone looking to quickly create impactful visuals. By merging AI technology with intuitive design features, Skills.ai helps you tell your stories through visually compelling infographics.
A Detailed Walkthrough: Creating an Apple History Timeline Infographic with Skills.ai
Step 1: Preparing Your Data
Before you start creating your infographic, you need to gather the data that will form its backbone. This includes key events, dates, and brief descriptions of each event. You can collect this data from historical records, company reports, or research papers. Skills.ai offers the option to manually enter your data or use its intelligent data extraction feature for quicker results.
If you have structured data, you can copy and paste it into Skills.ai's online spreadsheet. Make sure your data is organized with columns for time, event, and emoji. If you're working with raw text, Skills.ai's AI-powered event extraction feature can help identify key events. Clean and verify your data before inputting it to ensure accuracy and relevance. Organizing your data beforehand can save time and prevent errors.
For this walkthrough, we'll create a timeline infographic of Apple's history from its founding to its IPO. We'll include key events like the company's founding date, the release of its first products, and significant milestones in its early years. The data for this timeline is sourced from Wikipedia.
Step 2: Utilizing AI for Data Population
Skills.ai provides two methods for populating data into your timeline infographic: manual entry and AI-powered data extraction. For manual entry, you input the dates, events, and emojis into the designated fields on the Skills.ai platform. This method gives you complete control over the content and allows for fine-tuning of each entry.
For a more efficient approach, use the AI-powered event extraction feature. Input your raw text, and Skills.ai's AI algorithms will identify key events and dates, populating the corresponding fields. Click on the 'Automatically Populate with AI' button, paste your text into the provided box, and submit it for processing. After processing, review the extracted data in the online spreadsheet and make any necessary adjustments for accuracy and clarity.
This AI functionality is particularly useful for extracting data from lengthy articles, historical documents, or company reports, saving you significant time and effort. Ensure your raw text contains clear and concise descriptions of each event to maximize the accuracy of the AI extraction. For our Apple history timeline, we'll use this feature to populate the timeline with key milestones from Apple's early years.
Step 3: Customizing Your Infographic's Appearance
With your data populated, it's time to customize your infographic's appearance to match your branding and aesthetic preferences. Skills.ai offers a range of options, including theme selection, font choices, color palettes, and image integration.
Start by selecting a title and subtitle that accurately represent your infographic's content. Skills.ai often generates these automatically based on your input data, but you can modify them to better capture the essence of your timeline.
You can choose between a light or dark theme, depending on your preferences and the overall tone of your infographic. Skills.ai offers several default color palettes, but you can also create your own custom color palette to match your branding guidelines. Ensure the colors you choose are visually appealing and enhance readability. Customize author and source information, adding your Twitter handle if desired.
Consider adding relevant images or icons to enhance the visual appeal of your infographic. Skills.ai provides a library of free icons, or you can upload your own custom images. Select images that are relevant to the events in your timeline and contribute to the overall message of your infographic. Through these customization options, Skills.ai empowers you to create a visually compelling infographic that effectively communicates your message to your target audience.
Step 4: Reviewing and Submitting Your Timeline Infographic
Before finalizing your timeline infographic, take the time to carefully review all the data, customizations, and visual elements. Verify that all dates, events, and descriptions are accurate and consistent. Ensure the timeline flows smoothly and is easy to follow. Proofread for any spelling or grammatical errors. Once satisfied with the accuracy and clarity, submit your infographic for generation.
Skills.ai will process your data and customizations to create the final version of your timeline infographic. The generated infographic will be in a high-resolution format suitable for both online and offline use. Download your infographic in various formats like JPEG, PNG, or SVG, depending on your needs. Share your infographic on social media, embed it on your website, or include it in your presentations. By following these steps, you can create a professional-quality timeline infographic that effectively communicates your message and engages your audience.
Step-by-Step Guide: Creating Timeline Infographics with Skills.ai
Step 1: Access Skills.ai and Select a Template
Start by navigating to the Skills.ai website. Once there, you can browse the available templates or begin from scratch. Skills.ai offers various templates designed for different types of infographics, including timelines, process flows, and comparison charts. Choose a timeline template that suits your needs and branding.
If you prefer to start from scratch, select a blank canvas and manually add all the elements to your infographic. For this guide, we'll use a timeline template to streamline the creation process. Review the available templates and choose one that aligns with your design aesthetic and data presentation needs.
Step 2: Data Input Methods
There are two ways to input data into your Skills.ai timeline: manually or through AI. If you have structured data, copy and paste it into the online spreadsheet provided by Skills.ai.
Ensure your data is organized with columns for time, event, and emoji. If you have raw text containing the information, use the AI-powered event extraction feature. This function allows Skills.ai's AI algorithms to automatically detect key events and dates, populating the corresponding fields. Click the 'Automatically Populate with AI' button and paste your text into the provided box.
Step 3: Customization Options
Once your data is uploaded, Skills.ai offers numerous customization options to refine your infographic's look and feel.
Begin by adjusting the title and subtitle to better reflect the data. You can tweak the overall theme to match your brand's aesthetic, choosing between light and dark themes. If you're a paid subscriber, you can remove the Skills.ai watermark. Modify individual emojis to ensure they accurately represent each event, enhancing the visual narrative.
Step 4: Submitting and Sharing Your Infographic
Once you're happy with your timeline infographic's data, customizations, and visuals, submit it for generation. Skills.ai will process your inputs and create the final version in a high-resolution format. Download your infographic in formats like JPEG, PNG, or SVG, depending on your needs. Share your infographic on social media, embed it on your website, or include it in your presentations. Use the share button on Skills.ai to leverage its features.
Skills.ai Pricing
Subscription Tiers and Features
Skills.ai offers different subscription tiers to meet varying user needs. The free tier provides access to a limited number of templates and features, while paid tiers unlock additional templates, advanced customization options, and priority support. Free users can create two standard definition infographics per month, while paid users can upgrade to higher quality output. Check the Skills.ai pricing page for the latest information on subscription tiers, features, and pricing details.
Evaluate your infographic creation needs and choose the subscription tier that best fits your requirements. The free tier might be sufficient if you only need to create a few basic infographics per month. However, if you need access to advanced features and priority support, consider upgrading to a paid tier.
Regardless of your chosen tier, Skills.ai provides a valuable tool for transforming data into visually compelling infographics.
Pros and Cons of Using Skills.ai
Pros
- User-friendly interface
- AI-powered data extraction
- Customizable templates
- Versatile infographic creation
- Professional-quality output
Cons
- Limited features in the free tier
- May require a paid subscription for advanced customization
- AI data extraction may not be perfect and may require manual adjustments
Skills.ai Core Features
Key Functionalities for Infographic Creation
Skills.ai offers a comprehensive suite of features designed to simplify and enhance the infographic creation process. These include:
- AI-Powered Data Extraction: Automatically extracts key events and dates from raw text.
- Customizable Templates: Offers a variety of templates that can be tailored to your specific needs and branding.
- Drag-and-Drop Interface: Provides a user-friendly interface for easy infographic creation.
- Theme Selection: Allows you to choose between a light or dark theme for your infographic.
- Color Palette Customization: Enables you to create custom color palettes to match your branding guidelines.
- Image Integration: Supports the integration of relevant images or icons to enhance visual appeal.
- High-Resolution Output: Generates high-resolution infographics suitable for both online and offline use.
- Multiple Download Formats: Allows you to download your infographic in various formats, such as JPEG, PNG, or SVG.
By combining these features, Skills.ai empowers users to create professional-quality infographics without needing extensive design skills. Use the AI-powered data extraction feature to save time and effort. Choose a template that aligns with your specific needs and branding. Leverage the drag-and-drop interface to easily add and arrange elements. Customize the theme and color palette to match your brand guidelines. Integrate relevant images or icons to enhance visual appeal. With Skills.ai, the possibilities are endless.
Skills.ai Use Cases
Applications Across Industries
Skills.ai's versatility makes it applicable across a wide range of industries and use cases. Here are a few examples:
- Marketing: Create engaging infographics to promote products, services, or events.
- Education: Develop visually appealing learning materials for students of all ages.
- Business: Communicate complex data and insights to colleagues and clients.
- Journalism: Present news and information in a concise and visually appealing format.
- Nonprofits: Raise awareness for important causes and initiatives.
In marketing, Skills.ai can help create eye-catching infographics that highlight product features, showcase customer testimonials, or illustrate market trends. In education, it can be used to develop interactive learning modules, present historical timelines, or explain scientific concepts. In business, Skills.ai can create data-driven presentations, visualize project timelines, or communicate company performance metrics. Consider how Skills.ai can improve communication and engagement within your specific industry and organization.
FAQ
Can I use Skills.ai for free?
Yes, Skills.ai offers a free tier with limited features. You can create a limited number of infographics per month and access a selection of basic templates. To unlock additional templates, advanced customization options, and priority support, you'll need to upgrade to a paid subscription.
Do I need design skills to use Skills.ai?
No, Skills.ai is designed to be user-friendly and accessible to everyone, regardless of their design expertise. The platform offers a drag-and-drop interface, customizable templates, and AI-powered data extraction, making it easy to create professional-quality infographics without any prior design experience.
What file formats are supported for downloading infographics?
Skills.ai allows you to download your infographics in various formats, including JPEG, PNG, and SVG. This provides flexibility for using your infographics across different platforms and applications.
Can I customize the color palette of my infographics?
Yes, Skills.ai allows you to create custom color palettes to match your branding guidelines. This ensures that your infographics are visually consistent with your other marketing materials and brand identity.
Is there customer support available for Skills.ai?
Yes, Skills.ai offers customer support to assist you with any questions or issues you may encounter. Paid subscribers receive priority support, ensuring timely and effective resolution of their inquiries.
Related Questions
What are the best practices for designing effective infographics?
Designing effective infographics involves several key considerations. First, define your target audience and tailor your infographic's content and style to their interests and needs. Second, focus on clarity and conciseness, using visuals and text sparingly to communicate your message effectively. Third, choose a visually appealing layout that is easy to follow and guides the viewer's eye through the information. Fourth, use a consistent color palette and typography to maintain a professional and cohesive look. Finally, cite your sources to ensure credibility and avoid plagiarism.
Additional tips for designing effective infographics include:
- Use high-quality visuals: Images and icons should be clear, relevant, and visually appealing.
- Keep it simple: Avoid overwhelming the viewer with too much information.
- Tell a story: Structure your infographic to tell a compelling story that engages the viewer.
- Optimize for sharing: Make it easy for others to share your infographic on social media and other platforms.
- Test and iterate: Get feedback on your infographic and make revisions as needed to improve its effectiveness.


 Musk’s Grok: 1.5 Trillion Parameters and Cursor Code Absorption—Game Changer or Bluff?
Elon Musk is finally making a move.In the AI programming race, OpenAI and Anthropic are accelerating, while xAI appears to be lagging. Musk has often stated his aim to rival Claude, yet despite multiple updates to the Grok4.X series, the results look
Musk’s Grok: 1.5 Trillion Parameters and Cursor Code Absorption—Game Changer or Bluff?
Elon Musk is finally making a move.In the AI programming race, OpenAI and Anthropic are accelerating, while xAI appears to be lagging. Musk has often stated his aim to rival Claude, yet despite multiple updates to the Grok4.X series, the results look
 OpenAI Secretly Changes Charter to Make Removing Altman Harder
Following the 2023 coup-like incident, OpenAI has further solidified protections for CEO Sam Altman by updating its corporate bylaws. Recently released court documents reveal that Altman's position is now rock-solid, with substantially higher barrier
OpenAI Secretly Changes Charter to Make Removing Altman Harder
Following the 2023 coup-like incident, OpenAI has further solidified protections for CEO Sam Altman by updating its corporate bylaws. Recently released court documents reveal that Altman's position is now rock-solid, with substantially higher barrier
 Meta AI now responds to buyer messages on Facebook Marketplace
Facebook Marketplace introduces new Meta AI features, including automated replies to buyer inquiries, the company announced Thursday. The platform also leverages AI to accelerate item listings, summarize seller profiles, and now lets sellers offer sh
Meta AI now responds to buyer messages on Facebook Marketplace
Facebook Marketplace introduces new Meta AI features, including automated replies to buyer inquiries, the company announced Thursday. The platform also leverages AI to accelerate item listings, summarize seller profiles, and now lets sellers offer sh

Discover the 2026 latest top-rated AI recruiting tools on XIX.AI. Our curated list features powerful, game-changing solutions for screening resumes and automating candidate interview scheduling. Compare free vs paid options with real-world tests and weekly updated rankings. Find your perfect hiring assistant and streamline your recruitment today!
10 tools
xix.ai
Discover the 2026 best AI personal wellness and focus coaches on XIX.AI. Our curated rankings feature top-rated, game-changing tools to manage burnout and boost mental energy. Compare free vs paid options with real-world insights. Unlock your path to peak productivity and well-being today.
10 tools
xix.ai
Discover the 2026 latest top-rated AI romantic chatbots for building genuine, long-term connections. Our curated list features powerful, consistent personalities, free vs paid comparisons, and real-world tests. Find your perfect companion and start building today at XIX.AI.
10 tools
xix.ai

Discover the 2026 best AI data science mentors to master SQL, Pandas & ML workflows. Explore our top-rated, curated selection at XIX.AI for powerful, game-changing guidance. Compare free vs paid options with real-world insights. Unlock your data science mastery today.
10 tools
xix.ai

Discover the 2026 best AI flirting and conversation trainers on XIX.AI. Our curated, top-rated selection helps you build social charisma and confidence in real-time. Explore must-try, game-changing tools with free vs paid comparisons and weekly updated rankings. Unlock your social edge today.
10 tools
xix.ai

Discover the 2026 latest top-rated AI tools for automated unit testing. Our curated selection features powerful, game-changing solutions to generate Jest, PyTest & JUnit test cases instantly. Compare free vs paid options with real-world tests and weekly updated rankings on XIX.AI. Unlock your AI edge and boost development productivity today.
10 tools
xix.ai

This AI infographic tool sounds like a game-changer! I’m no designer, but I can see myself whipping up sleek timelines for my presentations. Excited to try it out! 😎
This AI-powered infographic guide is a game-changer! I love how it simplifies complex data into something visually awesome. Can't wait to try it for my next presentation! 😍
Super cool guide! AI making infographics so easy is a game-changer. Tried it and my timeline looks pro! 😎
This AI-powered guide for timeline infographics is a game-changer! 😍 I love how it simplifies complex data into something visually awesome. Can’t wait to try it for my next presentation!