


Ultimaps
AI Color-Coded Interactive Maps
Ultimaps Product Information
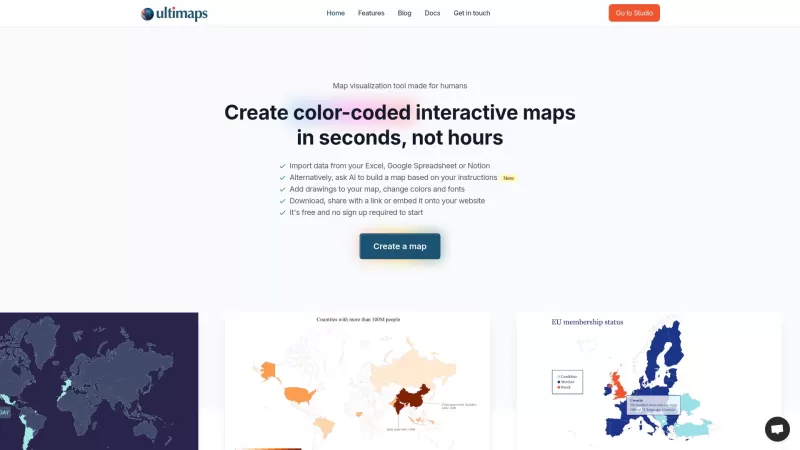
Ever wondered how to turn your data into a stunning, color-coded map in the blink of an eye? Well, let me introduce you to Ultimaps, the online app that's revolutionizing the way we visualize information. With Ultimaps, you can whip up detailed maps and charts from your Excel files or simply by chatting with our AI. Imagine saying, "I want a map of Europe with France, Spain, and Italy in red, the Nordic countries in blue, and the rest in white, all on a grey background," and voilà! Your map is ready. And it's not just static; you can jazz it up with interactive elements like tooltips and pop-ups, making your visualizations come alive. The best part? No special skills are needed. We've made it super easy for everyone to use!
How to Use Ultimaps?
Diving into Ultimaps is a breeze. Just hop into Ultimaps Studio, pick your base map—say, the U.S.—and hit the "Use AI" button. Then, type in your vision: "I want Oklahoma, Texas, Arkansas, and Louisiana in pink, California and Arizona in orange, Michigan, Ohio, and Minnesota in yellow. Color the rest of the states white and set the background to #CCCCDD." That's it! Your custom map is ready to roll.
Ultimaps's Core Features
- AI-Driven Map Creation: Just tell the AI what you want, and it crafts your map based on your instructions.
- Data Import: Seamlessly import data from Excel, Google Sheets, or Notion to start mapping.
- Customization: Add drawings, tweak colors, and play with fonts to make your map truly yours.
- Interactive Elements: Enhance your maps with interactive features like tooltips and pop-ups.
- Sharing and Embedding: Download your map, share it via a link, or embed it directly onto your website.
Ultimaps's Use Cases
- Presentations: Make your slides pop with custom maps that tell your story.
- Infographics: Create eye-catching infographics that are both informative and visually appealing.
- Mapping: From geographic to thematic maps, Ultimaps has you covered.
- Data Analytics: Visualize your data in new ways to uncover insights and trends.
- Sales Territory Maps: Plan and visualize your sales territories with ease.
Need help or have questions about Ultimaps? Check out our support options on the contact us page. Want to know more about what we're all about? Visit our about us page. With Ultimaps, turning your data into dynamic, shareable maps has never been more straightforward or fun!
Ultimaps Screenshot

Ultimaps Reviews
Would you recommend Ultimaps? Post your comment


Ultimaps is a game-changer for data visualization! 🗺️ Just uploaded a spreadsheet of customer locations and boom - instant color-coded geographic insights. Still learning all the features but already obsessed with the heat map function. Only wish I could export higher-res images for presentations! 🌎 #DataNerd


