Chartify
Chartify: AI Tool for Interactive Data Charts
Chartify Product Information
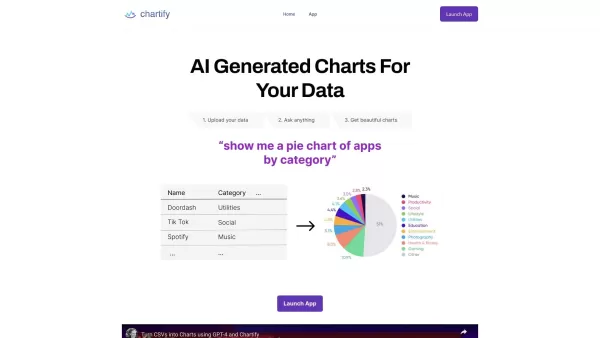
Chartify isn't just another tool; it's like having a data visualization artist at your fingertips! This AI-powered wonder transforms your CSVs and database tables into vibrant, interactive charts and graphs. It's not just about throwing data at you; Chartify suggests visualizations that actually make sense for your data, and you can even request specific types of charts. It's like having a conversation with your data, asking it to show off in the best way possible.
How to Dive into Chartify?
Getting started with Chartify is as easy as pie. Here's how you can get your data dancing:
- Upload Your Data: You can either upload a CSV file or connect directly to your Postgres or MySQL database. It's like inviting your data to the party.
- Explore AI Recommendations: Let the AI do its magic. It'll suggest visualizations tailored to your data. It's like Chartify is reading your data's mind!
- Get Specific: Want something particular? Just ask for it. Need a stacked bar chart showing revenue growth by product line over the last two decades? Chartify's got you covered.
Chartify's Star Features
AI-Generated Visualizations
Chartify uses AI to suggest the best ways to display your data. It's like having a personal data stylist who knows exactly what looks good.
Support for CSVs and Database Connections
Whether you're dealing with spreadsheets or databases, Chartify plays nice with both. It's the Swiss Army knife of data visualization.
A Smorgasbord of Charting Options
From pie charts that make your data digestible to line graphs that track trends over time, and bar charts that compare like a boss, Chartify's got a chart for every occasion.
Integration with Top Libraries
Chartify doesn't just work alone; it collaborates with the best in the business—Plotly, Matplotlib, Seaborn, and Charts.js. It's like having a team of visualization experts at your disposal.
When to Use Chartify?
- Data Analysis: When you need to dive deep into numbers and make sense of them.
- Data Visualization: To turn raw data into a visual story that anyone can understand.
- Reporting: For creating reports that aren't just numbers on a page but a visual journey.
- Presentations: To impress your audience with charts that do more than just look pretty.
- Business Intelligence: To uncover insights that drive smarter decisions.
Chartify FAQs
- What types of data sources does Chartify support?
- Chartify supports CSV files as well as Postgres and MySQL databases. It's like having a universal translator for your data.
- Can I ask for specific chart types?
- Absolutely! Just tell Chartify what you need, like a stacked bar chart of revenue growth, and watch it come to life.
- Which charting libraries does Chartify integrate with?
- Chartify plays well with Plotly, Matplotlib, Seaborn, and Charts.js. It's like having a whole band of visualization rockstars backing you up.
- What kind of users can benefit from using Chartify?
- Anyone from data analysts to business executives, from students to researchers—basically, anyone who wants to make their data look good and tell a story.
Chartify Screenshot


Chartify Reviews
Would you recommend Chartify? Post your comment