D&AVIZ
Data Visualization Tool
D&AVIZ Product Information
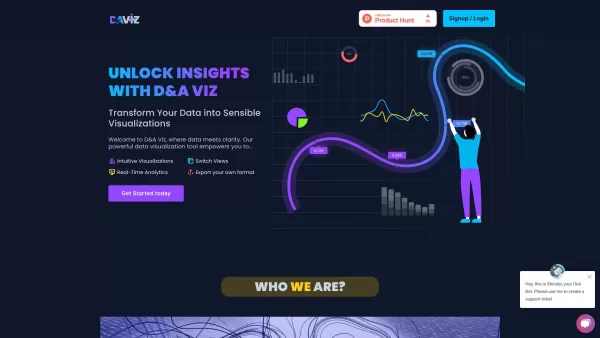
Ever wondered how to turn those heaps of data into something visually appealing and easy to understand? Well, let me introduce you to D&AVIZ, an AI-powered tool that's like magic for your spreadsheets. It's all about transforming raw, boring data into vibrant, informative visuals that not only look good but also help you make better decisions. Think of it as your personal data artist!
How to Use D&AVIZ?
Getting started with D&AVIZ is as easy as pie—or should I say, pie chart? Just upload your Excel or CSV files, throw in a query, and watch as D&AVIZ works its magic. Before you know it, you'll have pie charts, donut charts, or linear graphs popping up, turning your complex data into clear, actionable insights. It's like watching a data story unfold right before your eyes!
D&AVIZ's Core Features
Intuitive Visualizations
D&AVIZ doesn't just throw numbers at you; it crafts them into visuals that speak to you. Whether it's a trend you're trying to spot or a pattern you need to understand, D&AVIZ makes it all crystal clear.
Real-Time Analytics
Need to see what's happening right now? D&AVIZ provides real-time analytics, so you're always up to date. It's like having a live feed of your data's heartbeat.
Switch Views
Not satisfied with one view? No problem! Switch between different visualizations with ease. It's like having multiple perspectives on your data at your fingertips.
Export Your Own Format
Once you've got your insights, you can export them in your preferred format. Whether it's for a presentation or a report, D&AVIZ lets you take your visuals with you.
FAQ from D&AVIZ
- How do I upload data to D&AVIZ?
- Just drag and drop your Excel or CSV files into the upload section. It's that simple!
- Can I customize the visualizations?
- Absolutely! You can tweak colors, styles, and even the type of chart to fit your needs.
- How can I share my insights?
- Export your visualizations and share them via email, presentations, or any other platform you use.
- What are the benefits of visualizing data?
- Visualizing data helps you spot trends, understand patterns, and make informed decisions quickly and effectively.
- How can I contact D&AVIZ for support?
- Reach out to us via our support email or through the live chat on our website. We're here to help!
And who's behind this awesome tool? None other than Arivu IQ, Corp. They're the masterminds making data visualization a breeze with D&AVIZ.
D&AVIZ Screenshot

D&AVIZ Reviews
Would you recommend D&AVIZ? Post your comment