ChartEye
AI-driven Technical Analysis for every chart
ChartEye Product Information
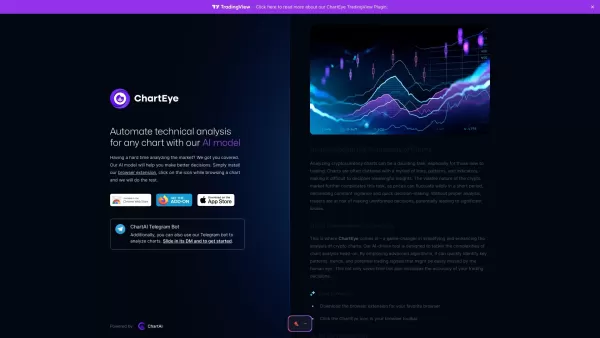
Ever felt like you're squinting at charts, trying to decipher those elusive patterns and trends? Well, let me introduce you to ChartEye, your new best friend in the world of technical analysis. This nifty tool harnesses the power of AI to whip up detailed reports on any chart you throw at it. With just a few clicks, ChartEye can spot those key patterns, trends, and potential trading signals that might slip past even the most eagle-eyed trader. It's like having a super-smart assistant by your side, making your analysis quicker and far less of a headache.
How to Use ChartEye?
Getting started with ChartEye is as easy as pie. You've got two options: either download our slick browser extension or chat with our friendly Telegram bot. If you go for the extension, just click on the ChartEye icon in your browser's toolbar. Got a specific ticker in mind? Simply type in the TA command in the Telegram bot, followed by the ticker symbol. Or, if you're feeling adventurous, upload your own chart image and let ChartEye work its magic. It's that simple!
ChartEye's Core Features
AI-Generated Technical Analysis Reports
ChartEye doesn't just give you raw data; it crafts comprehensive reports that break down the chart's story in a way that's easy to digest.
Identifies Key Patterns, Trends, and Trading Signals
From head and shoulders to bullish flags, ChartEye's AI is trained to pick out the signals that matter, helping you make more informed trading decisions.
Saves Time and Effort
Why spend hours staring at charts when ChartEye can do the heavy lifting in minutes? It's like having a team of analysts at your fingertips.
ChartEye's Use Cases
Crypto Trading
Whether you're diving into Bitcoin or exploring altcoins, ChartEye helps you navigate the volatile crypto markets with confidence.
Market Analysis
Need to understand the broader market trends? ChartEye's got you covered, providing insights that can guide your overall investment strategy.
Investment Research
For those deep dives into specific assets, ChartEye's detailed analysis can be a game-changer, helping you uncover hidden opportunities.
FAQ from ChartEye
- Why was my chart analysis brief or less detailed than expected?
- Sometimes, the complexity or clarity of the chart can affect the depth of the analysis. Ensure your chart has clear data points for the best results.
- What types of indicators should be present in the chart for optimal analysis?
- While ChartEye can work with various indicators, having a mix of volume, moving averages, and key technical indicators like RSI or MACD can enhance the analysis.
- How can I ensure the chart I submit is suitable for analysis?
- Make sure your chart is clear, with visible timeframes and data points. Avoid overly complex charts with too many overlapping indicators.
- What should I do if the analysis doesn't match my expectations?
- Try adjusting the chart or adding/removing indicators. If the issue persists, reach out to our support team for personalized assistance.
- Can the tool analyze charts with multiple indicators simultaneously?
- Absolutely! ChartEye is designed to handle multiple indicators, providing a comprehensive view of your chart.
- Is there a specific format or source for the chart that works best with the tool?
- While ChartEye is versatile, charts from popular trading platforms like TradingView or Binance often yield the best results due to their clarity and detail.
ChartEye Screenshot


ChartEye Reviews
Would you recommend ChartEye? Post your comment