


Graphy
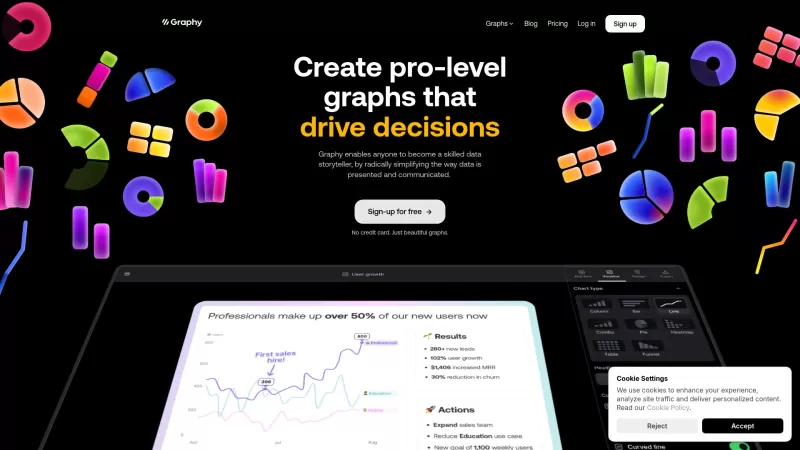
Pro Graphs for Data Storytelling
Graphy Product Information
If you're looking to transform raw data into compelling visuals, Graphy is your go-to tool. It's not just any data visualization platform; it's designed to make you look like a pro, even if you're new to the game. With Graphy, you can whip up professional graphs and charts that not only look fantastic but also help you communicate insights effectively and drive decisions based on your data.
How to Use Graphy?
Getting started with Graphy is a breeze. First, sign up for a free account - it's quick and painless. Once you're in, connect your data sources. Graphy plays nicely with a variety of them, so you're covered no matter where your data lives. Then, dive into the intuitive interface and start creating beautiful, actionable graphs. It's like having a graphic designer at your fingertips, but without the hefty price tag.
Graphy's Core Features
Professional Graph Creation
Graphy isn't messing around when it comes to creating professional-looking graphs. Whether you need a simple bar chart or a complex scatter plot, Graphy's got you covered. The tool ensures that your graphs are not just visually appealing but also convey your data story with clarity.
Interactive Data Storytelling
Ever wish your graphs could tell a story? With Graphy, they can. The platform allows you to create interactive data stories that engage your audience and make your data come alive. It's like turning your data into a mini-documentary, minus the boring parts.
Easy Integration with Data Sources
Connecting your data to Graphy is as easy as pie. Whether it's from spreadsheets, databases, or cloud storage, Graphy integrates smoothly, pulling in your data without a hitch. It's like having a universal translator for your data sources.
AI-Generated Insights
The cherry on top? Graphy uses AI to generate insights from your data. It's like having a smart assistant that not only creates graphs but also tells you what they mean. This feature can be a game-changer when you're trying to make sense of complex data sets.
Graphy's Use Cases
Visualize Data for Reports and Presentations
Need to jazz up your next report or presentation? Graphy can help you visualize your data in a way that's both informative and eye-catching. Say goodbye to boring slides and hello to engaging visuals that make your point crystal clear.
Collaborate in Real-Time with Teams
Working with a team? Graphy makes collaboration a snap. You can work on graphs together in real-time, ensuring everyone's on the same page. It's like having a virtual whiteboard where everyone can contribute and see changes as they happen.
Create Graphs for Social Media and Newsletters
Want to share your data insights with the world? Graphy's perfect for creating graphs that look great on social media or in newsletters. Whether you're trying to go viral or just keep your subscribers informed, Graphy helps you do it with style.
FAQ from Graphy
- ### Is Graphy free to use?
- Graphy offers a free tier, but there are also premium features available for those who need more advanced functionality.
- ### What data sources can I connect to Graphy?
- Graphy supports a wide range of data sources including spreadsheets, databases, cloud storage solutions, and more. Check their website for the full list.
Graphy Company
Graphy Company name: Graphy Technologies Ltd.
Graphy Login
Graphy Login Link: https://graphy.app/signup?utm_source=toolify&referrer=graphy.app
Graphy Sign up
Graphy Sign up Link: https://graphy.app/signup?utm_source=toolify&referrer=graphy.app
Graphy Pricing
Graphy Pricing Link: https://graphy.app/pricing?utm_source=toolify
Graphy Youtube
Graphy Youtube Link: https://www.youtube.com/@graphy151
Graphy Tiktok
Graphy Tiktok Link: https://www.tiktok.com/@graphy.app
Graphy Linkedin
Graphy Linkedin Link: https://www.linkedin.com/company/graphyhq/
Graphy Twitter
Graphy Twitter Link: http://twitter.com/graphyhq
Graphy Instagram
Graphy Instagram Link: https://www.instagram.com/graphyhq/
Graphy Screenshot


Graphy Reviews
Would you recommend Graphy? Post your comment


¡Graphy es genial para convertir mis datos aburridos en visuales cool! Es súper fácil de usar, incluso si no eres un profesional. Lo único es que puede ser un poco lento a veces, pero los resultados siempre valen la pena. ¡Definitivamente lo recomiendo!
Graphy é incrível para transformar meus dados chatos em visuais legais! É super fácil de usar, mesmo que você não seja um profissional. A única coisa é que pode ser um pouco lento às vezes, mas os resultados sempre valem a pena. Definitivamente recomendo!
Graphy는 지루한 데이터를 멋진 비주얼로 바꾸는 데 최고예요! 사용하기도 정말 쉬워서 전문가가 아니어도 괜찮아요. 다만, 가끔 조금 느릴 때가 있지만, 결과는 항상 그 가치가 있어요. 강력 추천합니다!
Graphyは私の退屈なデータをクールなビジュアルに変えるのに最高です!使い方もとても簡単で、プロでなくても大丈夫です。ただ、時々少し遅いことがありますが、結果はいつもその価値があります。ぜひおすすめします!

Graphy is awesome for turning my boring data into cool visuals! It's super easy to use, even if you're not a pro. The only thing is, it can be a bit slow sometimes, but the results are always worth it. Definitely recommend!


